Source page: McKinsey & Company
Commentary
A new space age
Aerospace | Strategy
April 27, 2023 – With the space economy valued at $500 billion and growing, executives need to think about making space part of their strategy, managing partner Bob Sternfels and colleagues note. Launch costs have fallen 95 percent, as satellites increase cost performance and boost their capability improvements per size, weight, and power by harnessing the scale of commercial electronics such as semiconductors.
To read the article, see “Space: The missing element of your strategy,” March 27, 2023.
customizer here
Visual form
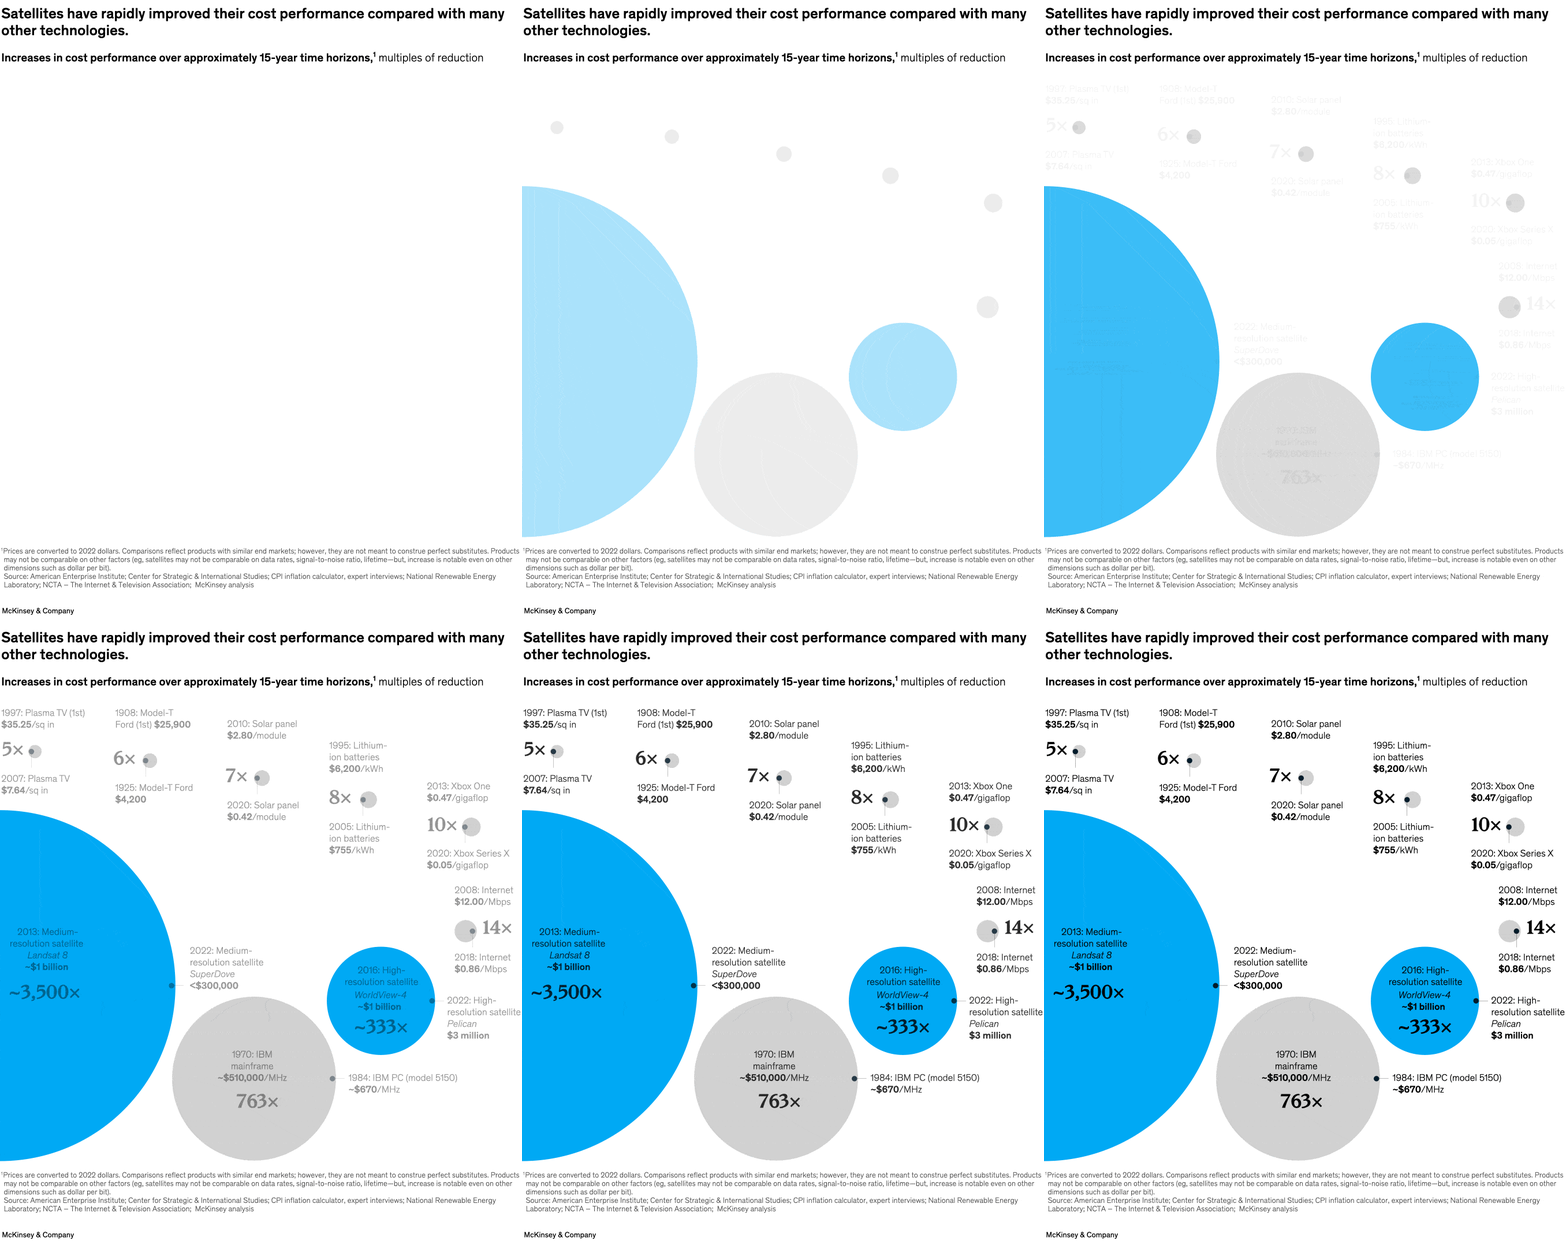
Bubble-size comparison chart with cost-reduction callouts.
Layout / body structure
The visual is arranged as a field of labeled circles, with each technology pair linked by text callouts for an earlier cost point and a later cost point, and the largest satellite bubbles anchoring the lower half of the page.
What is being compared
It compares the increase in cost performance over roughly fifteen-year periods across satellites and several other technologies, including internet bandwidth, game consoles, lithium-ion batteries, solar panels, cars, televisions, and computing hardware.
Measurement system
The measure is multiples of cost reduction, shown directly inside or beside the circles, while the callouts around each marker provide the starting and ending cost figures for the technology pair.
Visible structure inside the graphic
Large bubbles represent the biggest performance gains, smaller dots and circles mark the lower-multiple technologies, and each bubble is connected to text labels naming the technology and the earlier and later price points being compared.
Main takeaway from the visual
Satellite cost performance dwarfs many of the comparison technologies, with medium-resolution and high-resolution satellites appearing as the two dominant blue circles, so the chart makes the space-industry cost drop look exceptional rather than incremental.
Key standout values or extremes
The largest bubble is medium-resolution satellites at about 3,500 times improvement, high-resolution satellites are shown at about 333 times, the IBM mainframe to PC comparison at 763 times, internet bandwidth at 14 times, Xbox computing at 10 times, lithium-ion batteries at 8 times, solar panels at 7 times, Model T at 6 times, and plasma TV at 5 times.
Controls / sequence, when applicable
This is a static chart image with no in-chart controls to operate.
Companion media, when applicable
There is no separate companion audio or video; the chart image is the full visual on this page.