Source page: McKinsey & Company
Commentary
Core to the energy transition
Decarbonization | Sustainability
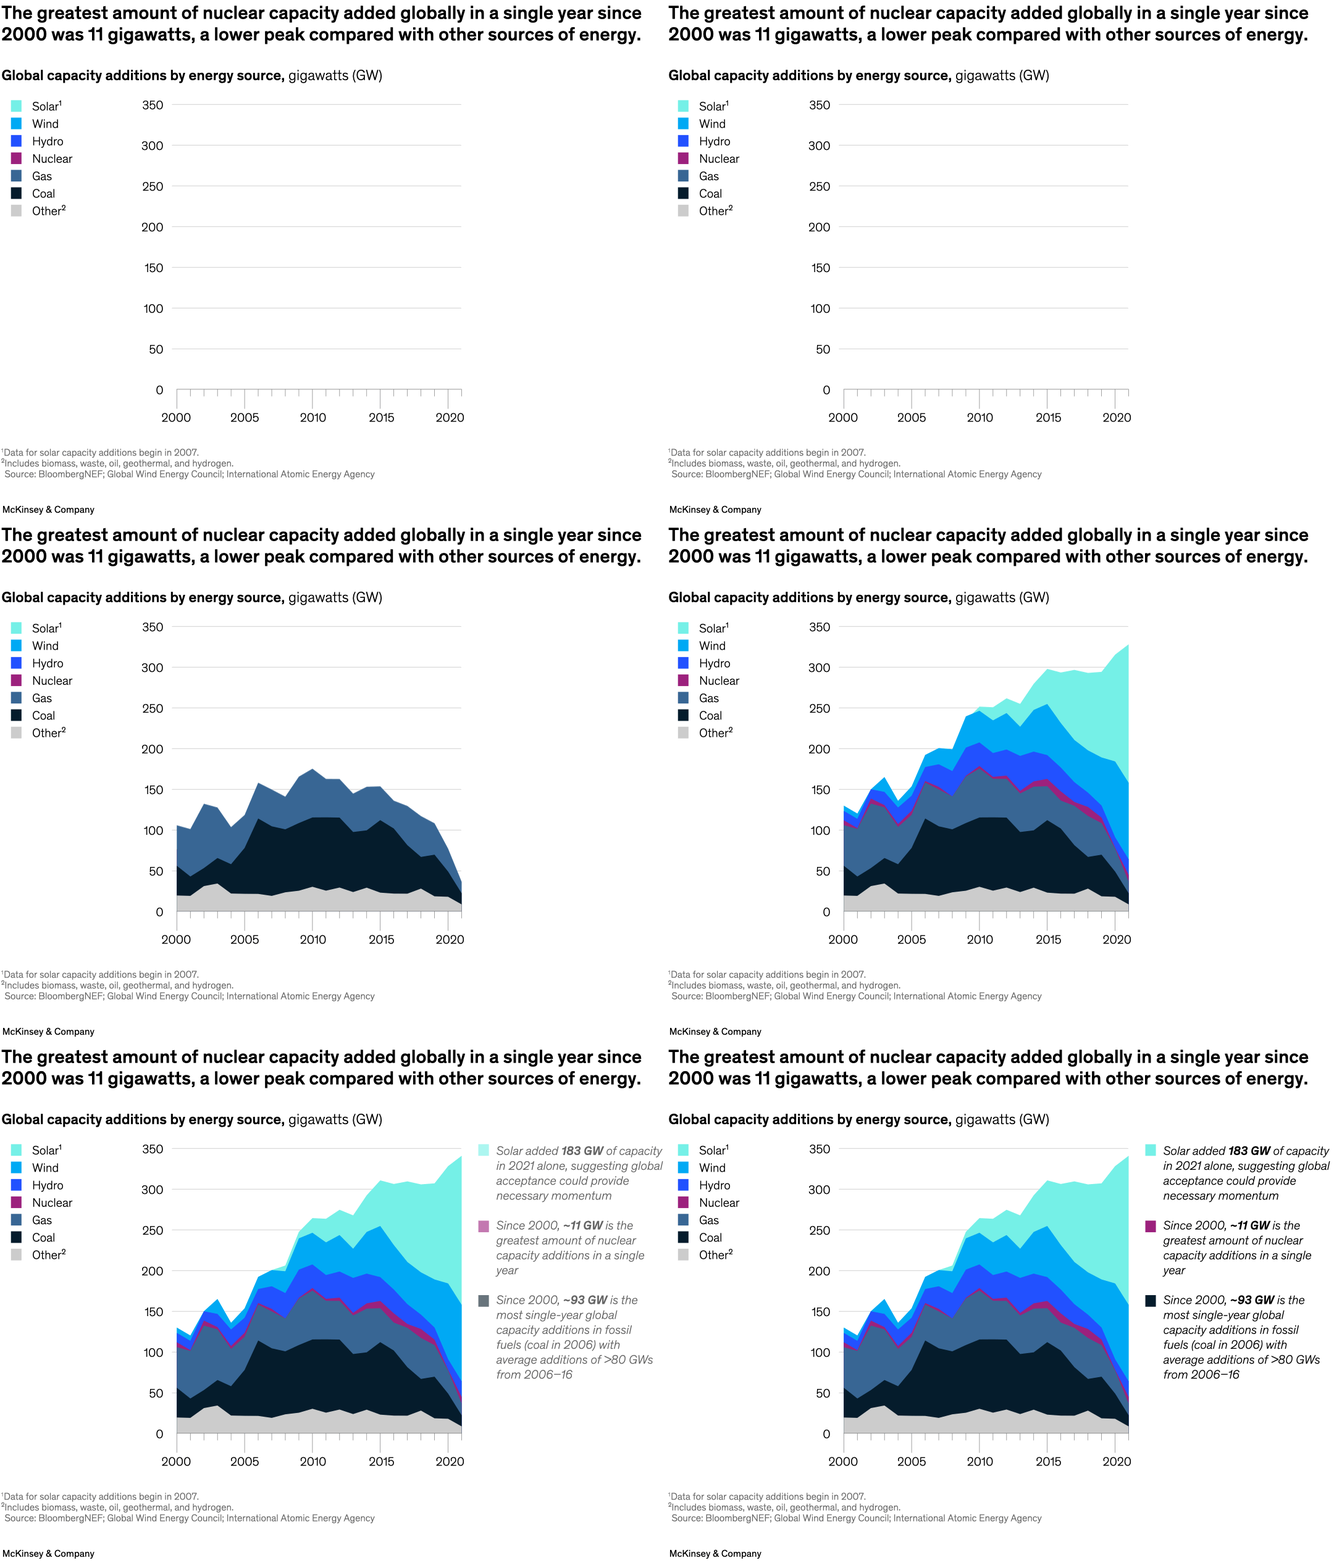
April 17, 2023 – Nuclear power is a zero-carbon electricity source that can play a key role, alongside renewables, in the energy transition. Maximizing nuclear’s decarbonization potential could require a ramp-up to approximately 50 gigawatts (GW) per year of new nuclear capacity, according to partner Bill Lacivita and coauthors. This uptick presents a steep task for the industry, which, since 2000, has had a peak of 11 GW of added capacity in a single year.
To read the article, see “What will it take for nuclear power to meet the climate challenge?,” March 21, 2023.
customizer here
Visual form
Stacked area chart by energy source.
Layout / body structure
A single timeline spans 2000 to 2021, with annual global capacity additions stacked vertically by source and read left to right across the full period.
What is being compared
It compares annual global capacity additions across solar, wind, hydro, nuclear, gas, coal, and other energy sources.
Measurement system
The vertical measure is gigawatts of annual capacity additions, and the stacked layers show how much each energy source contributes to the total in each year.
Visible structure inside the graphic
The chart is built from layered colored bands, with coal and gas forming large middle layers through much of the series, solar rising sharply at the end, and a thin magenta nuclear band remaining comparatively small throughout.
Main takeaway from the visual
Nuclear additions stay modest relative to the larger peaks reached by other sources, so even though nuclear appears consistently in the mix, its maximum annual addition is visibly much lower than the biggest surges for solar, wind, gas, or coal.
Key standout values or extremes
The headline gives nuclear’s peak at 11 gigawatts in a single year since 2000, while the chart shows solar jumping past 100 gigawatts by the end of the series and the total stack peaking much higher in the late 2000s and early 2010s.
Controls / sequence, when applicable
This is a static chart image with no in-chart controls to operate.
Companion media, when applicable
There is no separate companion audio or video; the chart image is the full visual on this page.