Source page: McKinsey & Company
Commentary
Breaking the cycle
Public Sector | Public Health
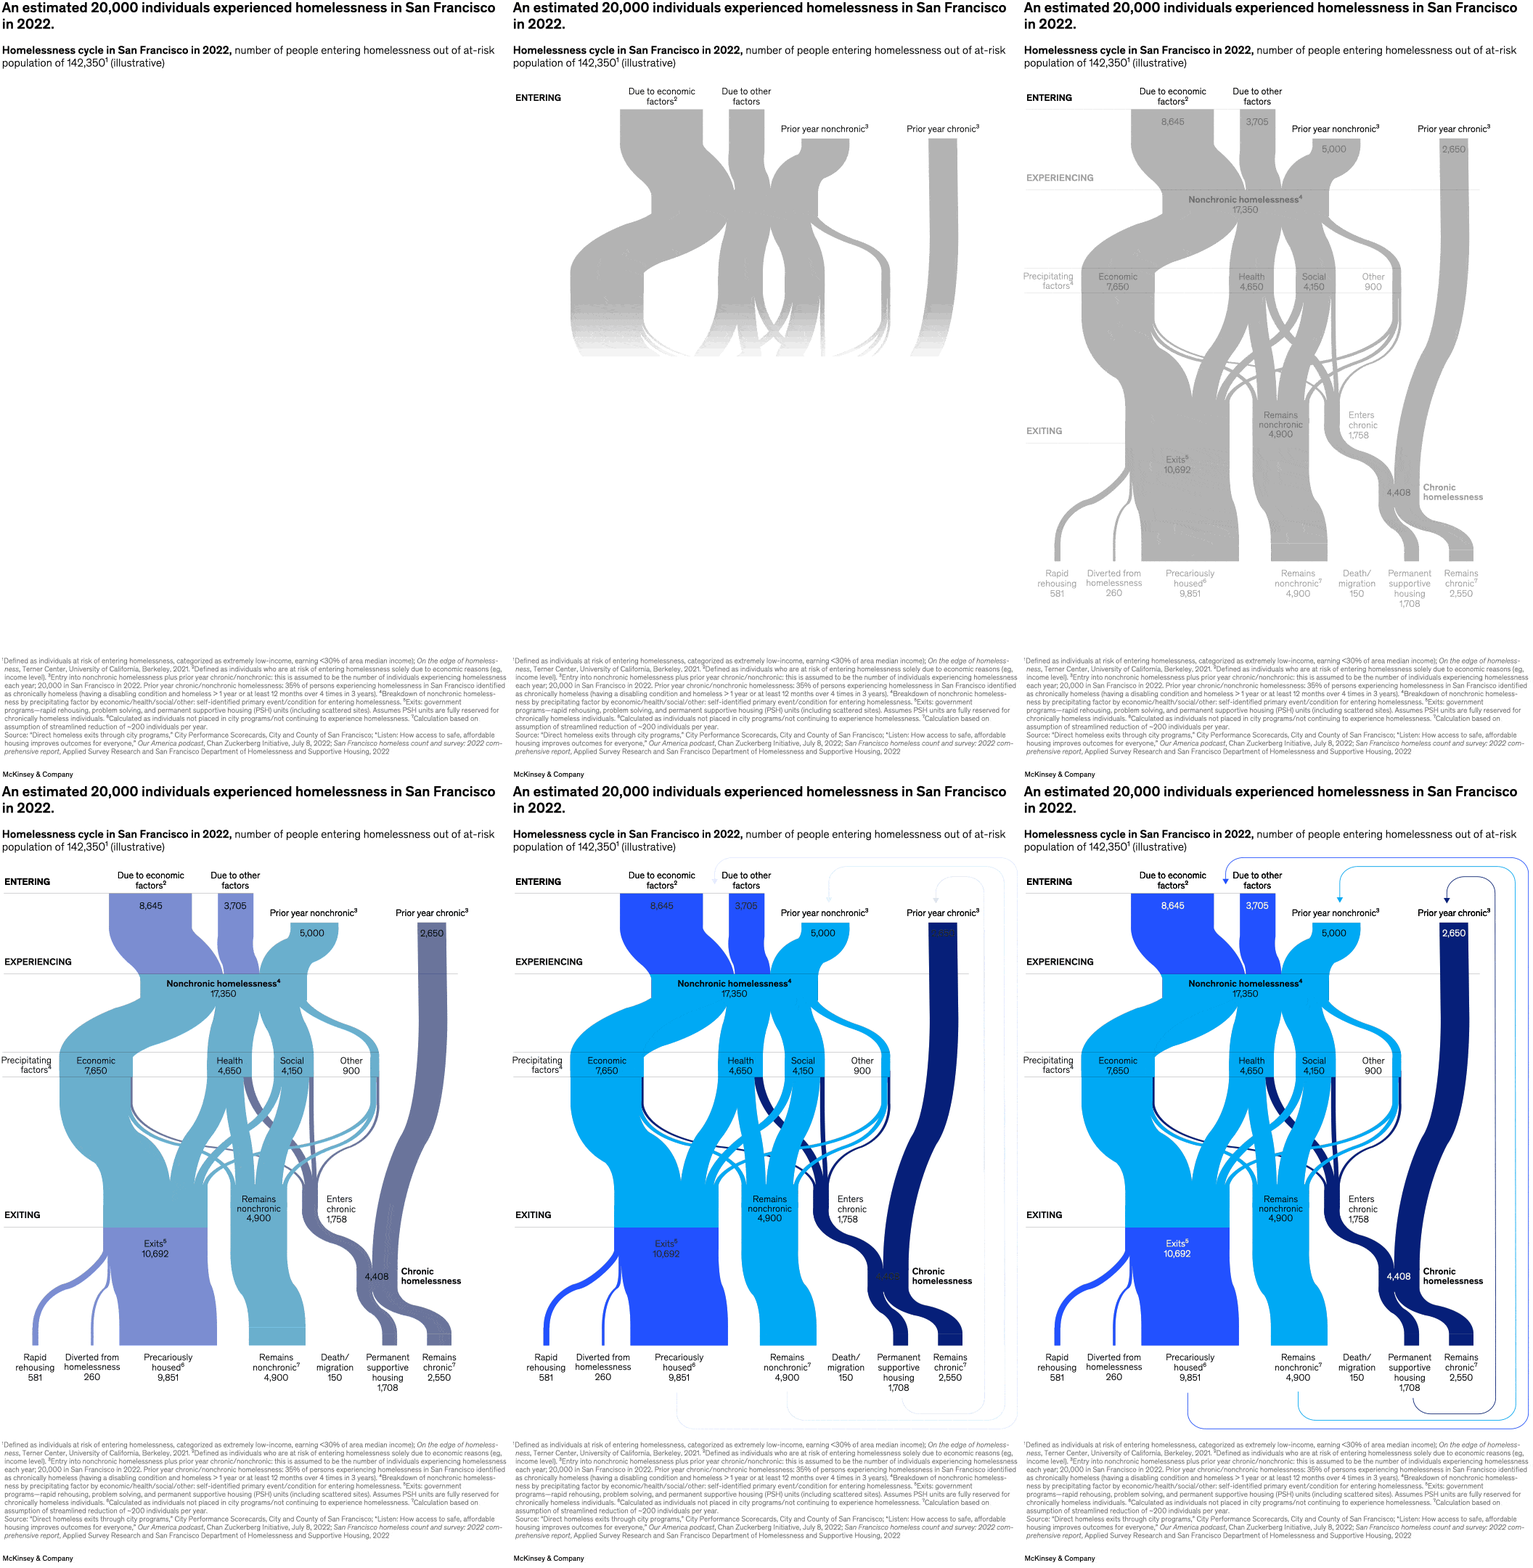
April 14, 2023 – Homeless experiences vary, but a cycle can start to develop for many individuals, write senior partners Alexis Krivkovich and Robert Schiff and coauthors. In the Bay Area, for example, the 20,000 people who experienced homelessness in 2022 might have found themselves entering, exiting, and reentering a complex maze of shelters, services, and programs that vary not only in size, scope, and approach but also in effectiveness. Three strategies to help alleviate for the ongoing homelessness crisis include bolstering housing affordability and income security, improving coordination among agencies in the response system, and investing in intensive care pathways.
To read the article, see “The ongoing crisis of homelessness in the Bay Area: What’s working, what’s not,” March 23, 2023.
customizer here
Visual form
Sankey flow diagram.
Layout / body structure
The page is structured in three horizontal bands labeled Entering, Experiencing, and Exiting, and the reader follows the flows from left to right through the San Francisco homelessness cycle.
What is being compared
It compares pathways into homelessness, the composition of people currently experiencing homelessness, and the different ways people exit or remain in the system, including movement into chronic homelessness.
Measurement system
The measure is number of people, represented by the width of the flow bands rather than by an axis, with labeled node totals marking the largest categories.
Visible structure inside the graphic
The diagram uses thick blue and purple streams that merge and split across the three stages, with labeled nodes such as nonchronic homelessness, chronic homelessness, exits, and the entry-factor groupings that feed the system.
Main takeaway from the visual
The visual shows the system cycling people through several repeated paths rather than simply entering and leaving once, with large streams remaining nonchronic, some shifting into chronic homelessness, and only part of the flow exiting permanently or through rehousing.
Key standout values or extremes
The chart headline states that an estimated 20,000 individuals experienced homelessness in San Francisco in 2022; the largest central node is nonchronic homelessness at 17,350, while exits are labeled 10,692 and chronic homelessness 4,408.
Controls / sequence, when applicable
This is a static chart image with no in-chart controls to operate.
Companion media, when applicable
There is no separate companion audio or video; the chart image is the full visual on this page.