Source page: McKinsey & Company
Commentary
A healthy jump in funding
Healthcare | Africa | Digital
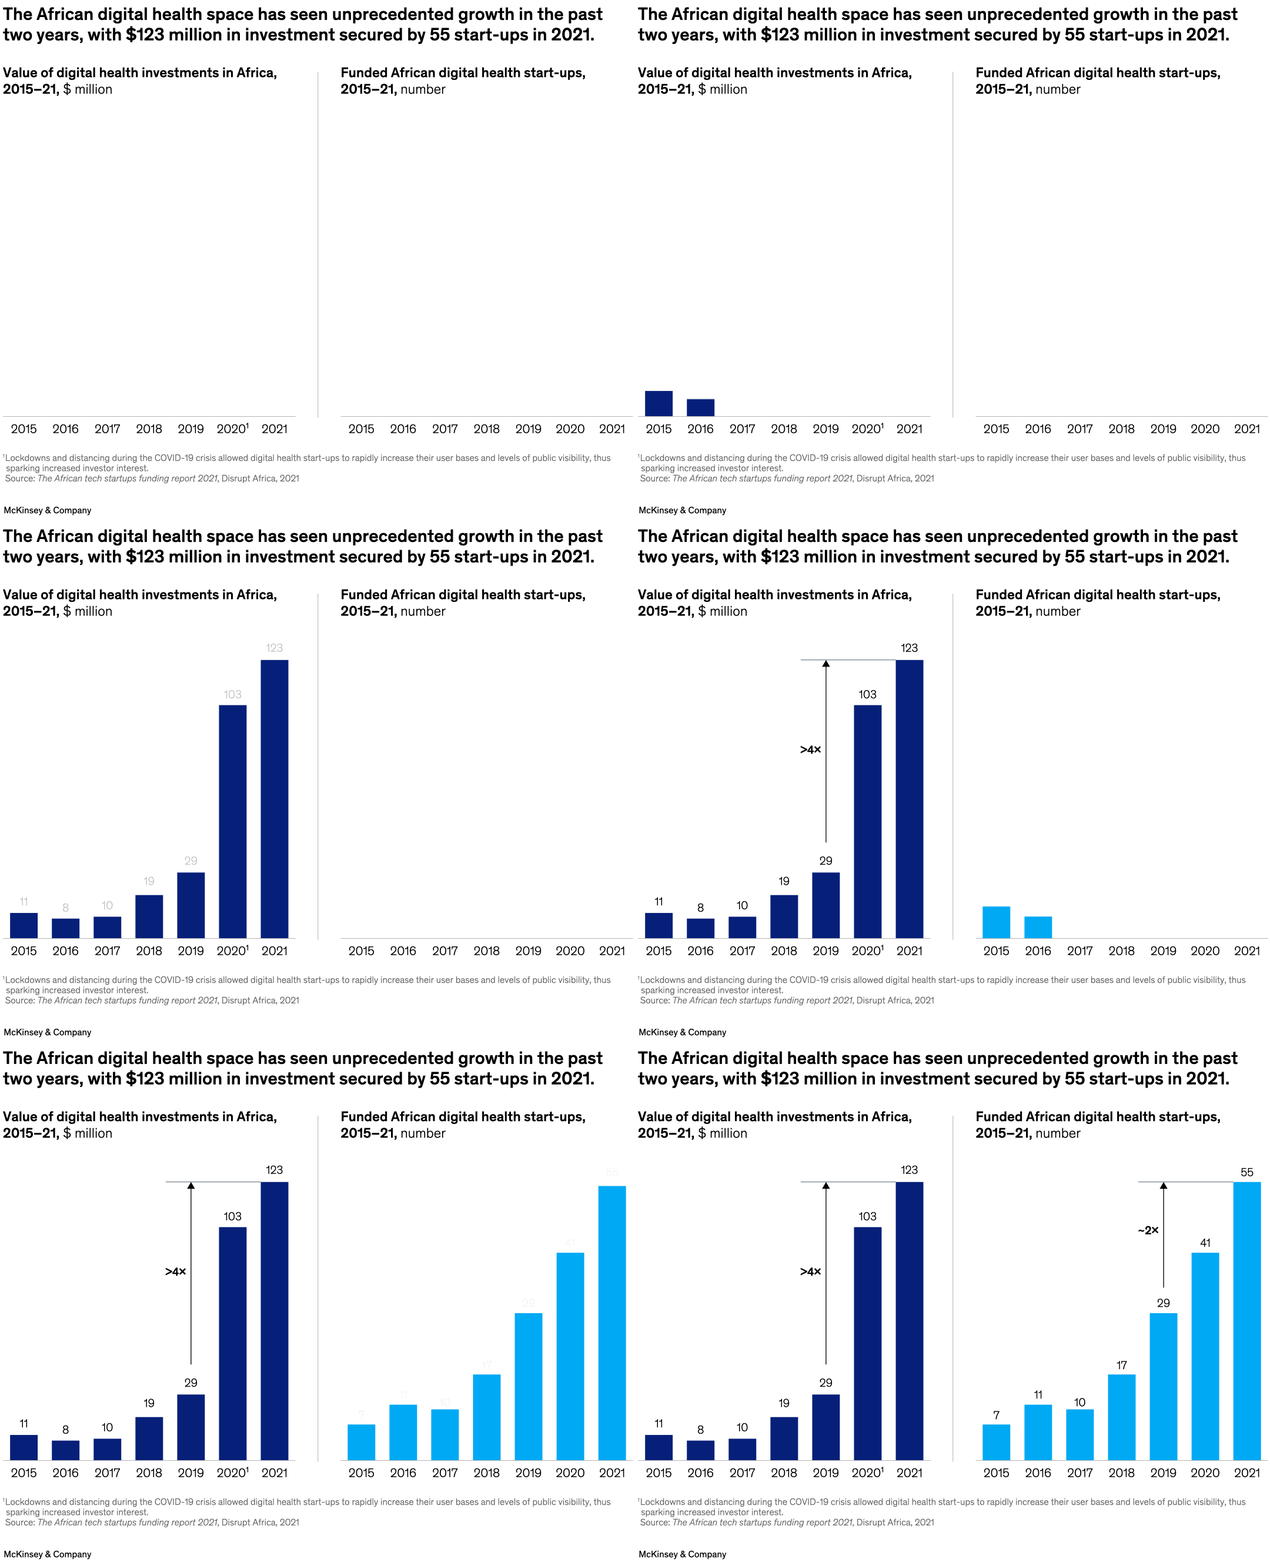
April 7, 2023 – Digital health tools, such as virtual interactions and paperless data, are getting a boost in Africa. That’s because digital health start-ups have seen an uptick in investment in recent years, find senior partner Matt Wilson and coauthors. For example, between 2019 and 2021, digital health investments on the continent jumped from $29 million to $123 million.
To read the article, see “How digital tools could boost efficiency in African health systems,” March 10, 2023.
customizer here
Visual form
Two-panel bar chart.
Layout / body structure
The visual is laid out as a left-to-right pair of annual bar charts: the left panel tracks investment value and the right panel tracks the number of funded start-ups over the same years.
What is being compared
It compares African digital health activity from 2015 through 2021 across two dimensions: the amount of investment raised and the number of start-ups receiving funding.
Measurement system
The left panel is measured in millions of dollars and the right panel is measured in number of funded start-ups, with each bar marking one year in the sequence.
Visible structure inside the graphic
Both panels use simple vertical bars with year labels along the bottom. The investment chart rises sharply in the final years, and the start-up chart climbs more steadily, with arrows and multiplier callouts emphasizing how quickly both series accelerate after 2019.
Main takeaway from the visual
The graphic shows a funding surge that is even steeper than the rise in the number of funded companies, which means the African digital health market is not just adding more start-ups but pulling in far larger amounts of capital by the end of the period.
Key standout values or extremes
Investment rises from 29 million dollars in 2019 to 103 million in 2020 and 123 million in 2021, a more than fourfold jump. Funded start-ups rise from 29 in 2019 to 41 in 2020 and 55 in 2021, roughly doubling over the same span.
Controls / sequence, when applicable
This is a static chart image with no in-chart controls to operate.
Companion media, when applicable
There is no separate companion audio or video; the chart image is the full visual on this page.