Source page: McKinsey & Company
Commentary
Road map to growth
Investing | Corporate finance | Strategy
April 6, 2023 – Companies should rely on ten rules in mapping their path to sustainable, value-creating growth—but these rules don’t all affect returns in the same way, find senior partners Chris Bradley and Jill Zucker and coauthors. Looking at a data set of almost 1,600 companies, they learned that winning market share away from competitors indicates a superior business model, as does investing in a core industry or region.
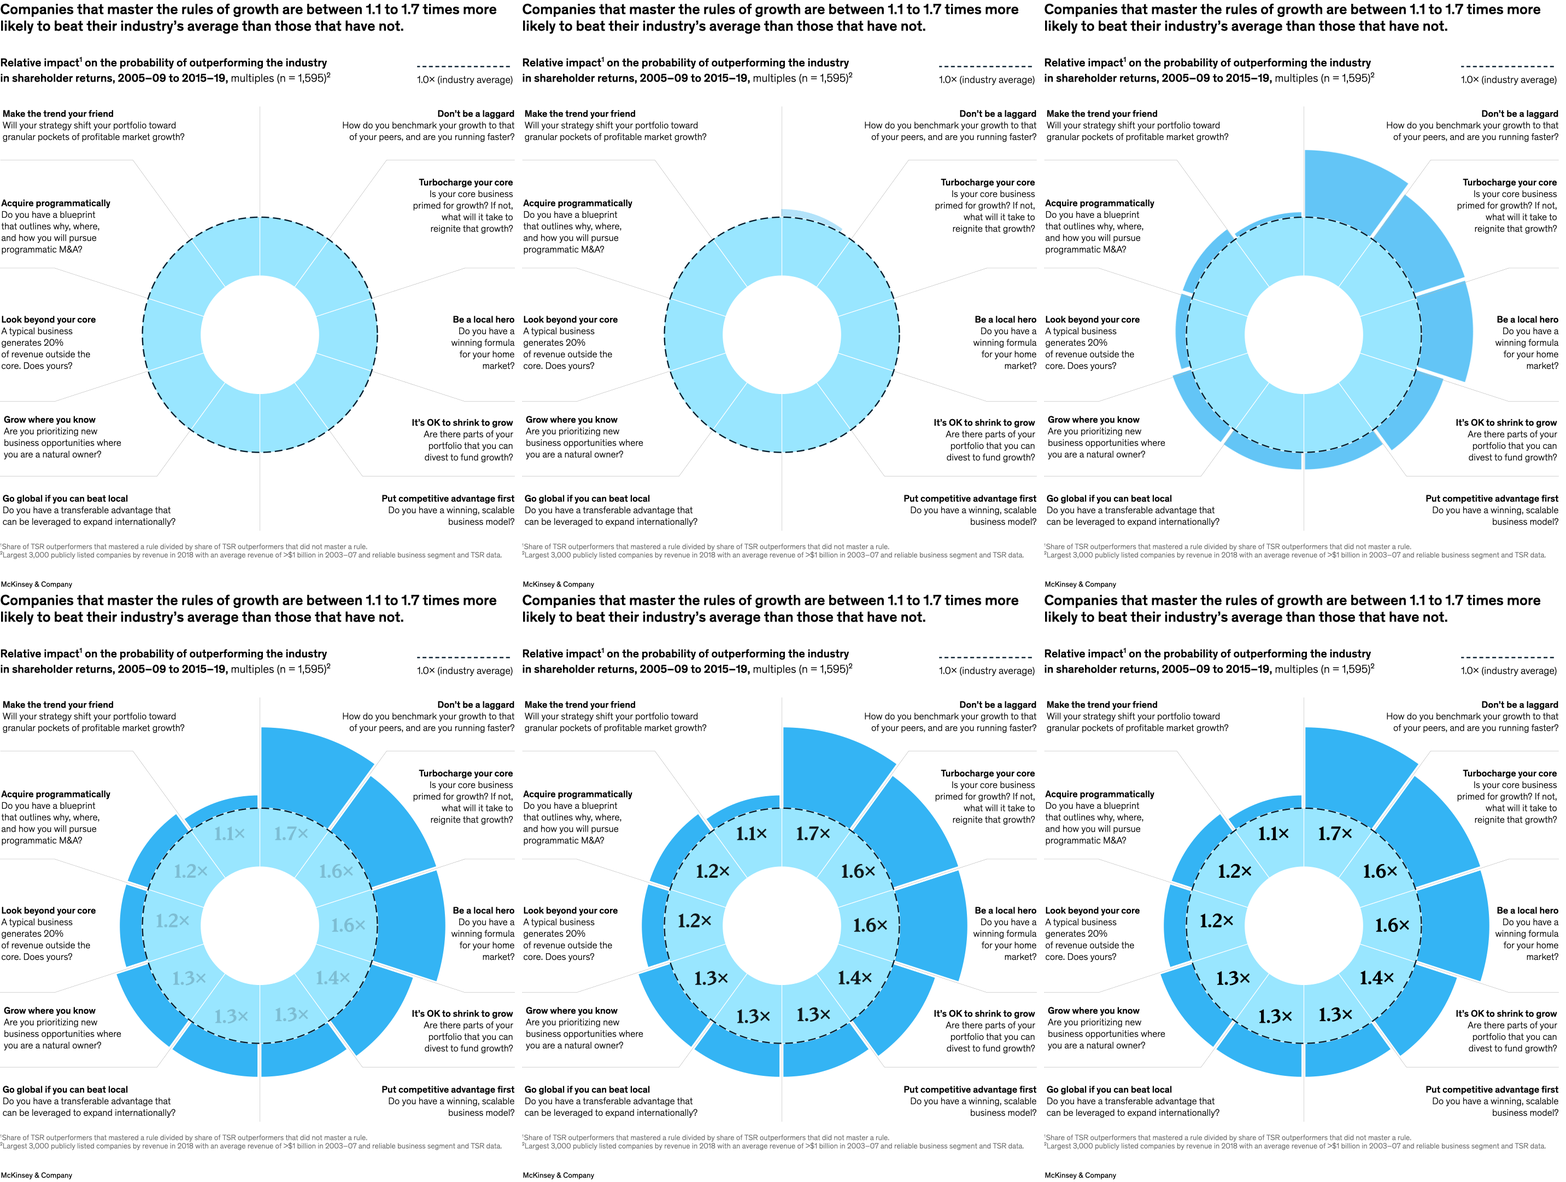
To read the article, see “Growth rules: Which matter most?,” March 6, 2023.
customizer here
Visual form
Radial ranking chart.
Layout / body structure
The page centers one wheel-like graphic, with ten wedges arranged around a circular core and each wedge labeled with one growth rule plus its performance multiple.
What is being compared
It compares ten different growth rules or strategic moves and how strongly each one is associated with outperforming an industry average in shareholder returns.
Measurement system
The values are shown as multiples relative to the industry average, so the reader is tracking whether each rule lifts the likelihood of outperformance above a 1.0 times baseline.
Visible structure inside the graphic
A dashed inner circle marks the 1.0 times industry-average reference point, while the outer wedges extend beyond it and are labeled with values from 1.1 times upward. Callout text sits around the circle so the reader can move clockwise through each rule and its associated multiplier.
Main takeaway from the visual
Every wedge sits above the 1.0 times baseline, so all ten rules are linked to better odds of outperformance, but the gains are not evenly distributed because a few rules push much farther beyond the center than the others.
Key standout values or extremes
The range runs from 1.1 times at the low end to 1.7 times at the high end. Two of the strongest wedges reach 1.6 times and one reaches 1.7 times, while several middle rules cluster around 1.2 to 1.4 times.
Controls / sequence, when applicable
This is a static chart image with no in-chart controls to operate.
Companion media, when applicable
There is no separate companion audio or video; the chart image is the full visual on this page.