Source page: McKinsey & Company
Commentary
Counting on analytics
Analytics | Banking
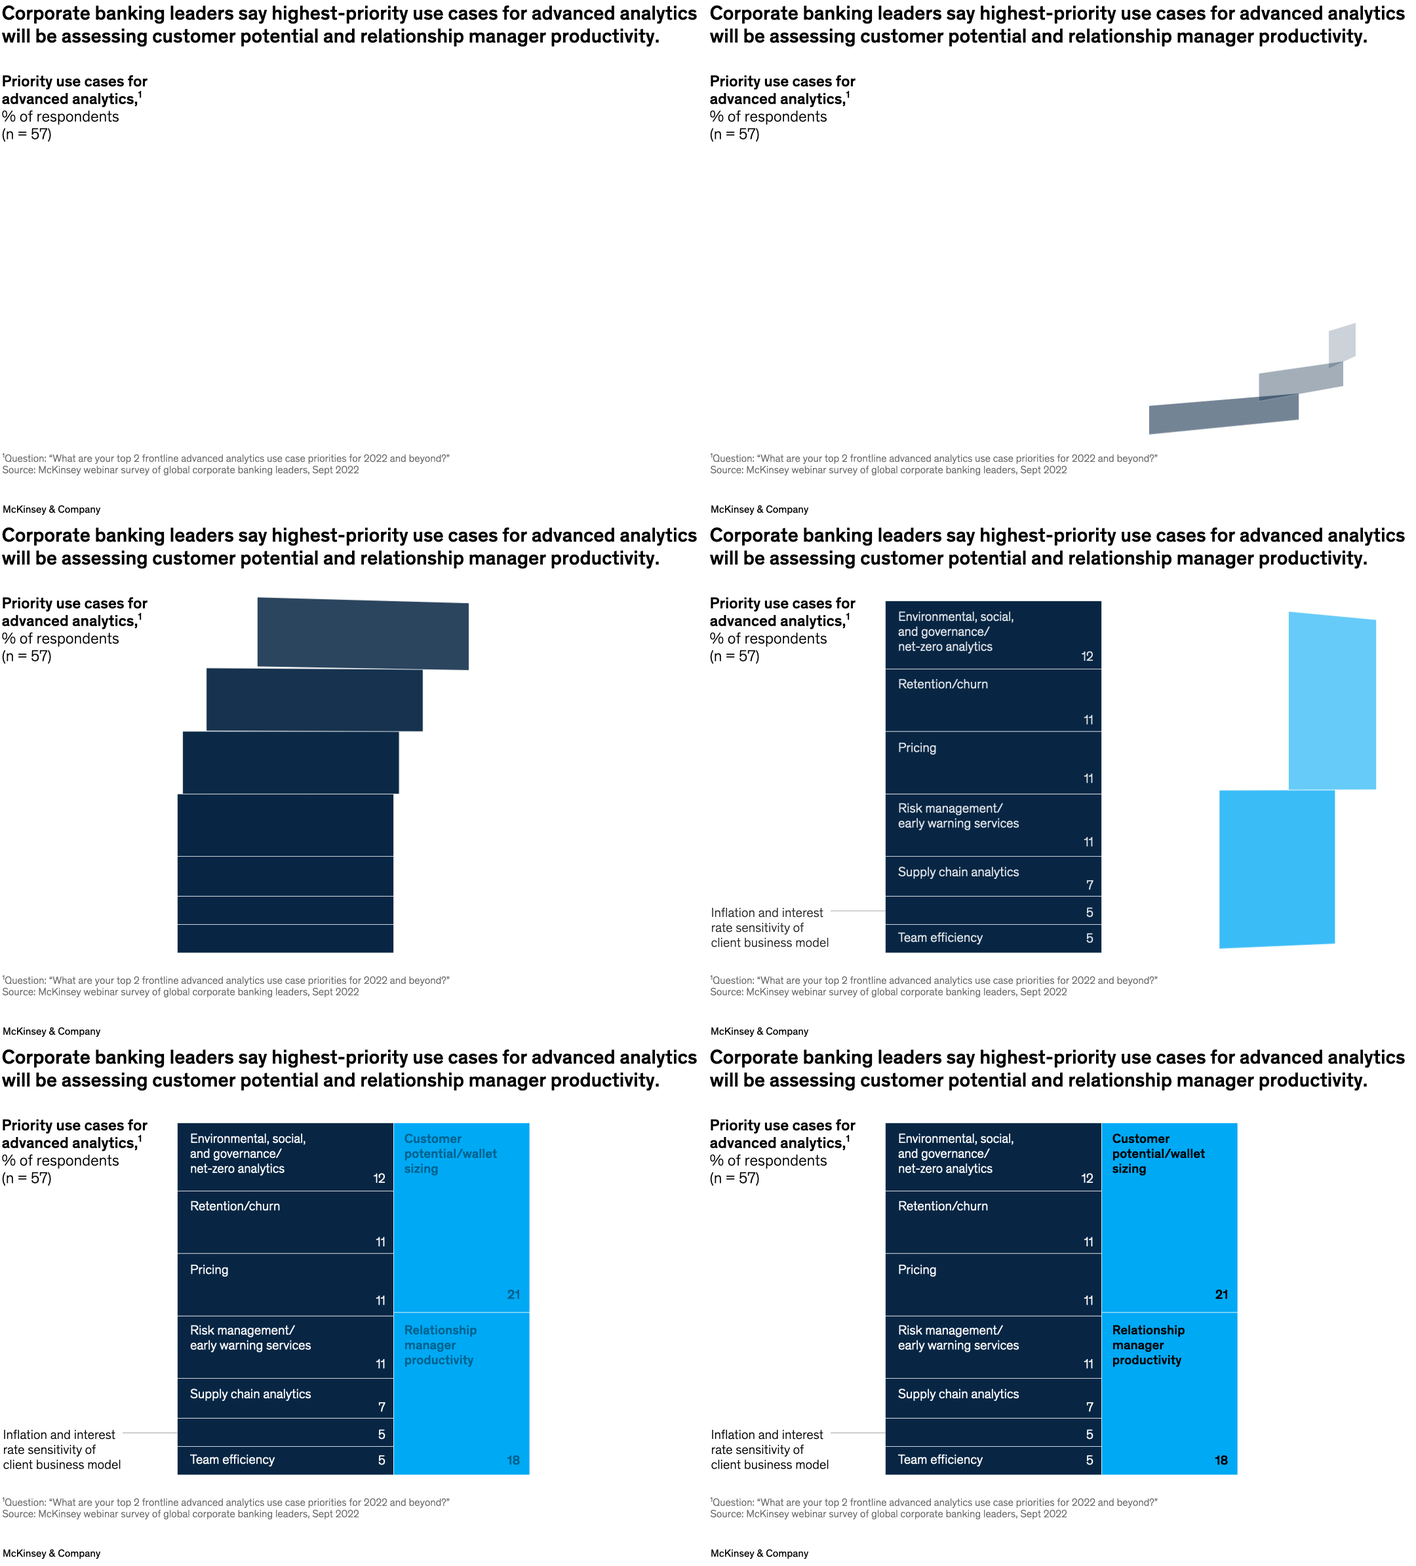
March 31, 2023 – Corporate and commercial banking accounted for $2.3 trillion of total global banking revenue last year. Succeeding in this sector now requires offering customers more personalized services, note partners Denis Francis and Imke Jacob and coauthor. Data-powered tools can help. Global banking leaders have cited assessing customer potential and relationship manager productivity as the highest-priority use cases for advanced analytics in the industry.
To read the article, see “The data and analytics edge in corporate and commercial banking,” March 9, 2023.
customizer here
Visual form
Proportional tile chart.
Layout / body structure
The page uses a single block layout made of adjoining rectangles, with the largest tiles stacked on the right and a column of smaller tiles running down the left side.
What is being compared
It compares the advanced-analytics use cases that corporate banking leaders rank as their highest priorities, including customer potential or wallet sizing, relationship manager productivity, ESG or net-zero analytics, retention, pricing, risk management, supply chain analytics, inflation sensitivity, and team efficiency.
Measurement system
The measure is percent of respondents, and the size of each tile corresponds to that share, so the graphic behaves like a ranked area chart rather than a set of equal bars.
Visible structure inside the graphic
Two bright blue tiles dominate the right side of the chart, while darker smaller tiles fill the left column. Each tile contains both the use-case label and its percentage, so the reader can compare ranking by area, by position, and by the printed values at the same time.
Main takeaway from the visual
The priorities are concentrated in just two uses cases, with customer potential or wallet sizing and relationship manager productivity clearly taking up the most space. The remaining use cases form a second tier of materially smaller priorities.
Key standout values or extremes
Customer potential or wallet sizing is the largest tile at 21 percent, and relationship manager productivity is next at 18 percent. ESG or net-zero analytics is 12 percent, pricing, retention or churn, and risk management are each 11 percent, supply chain analytics is 7 percent, and both inflation sensitivity and team efficiency are 5 percent.
Controls / sequence, when applicable
This is a static chart image with no in-chart controls to operate.
Companion media, when applicable
There is no separate companion audio or video; the chart image is the full visual on this page.