Source page: McKinsey & Company
Commentary
Rethinking administrative costs
Talent
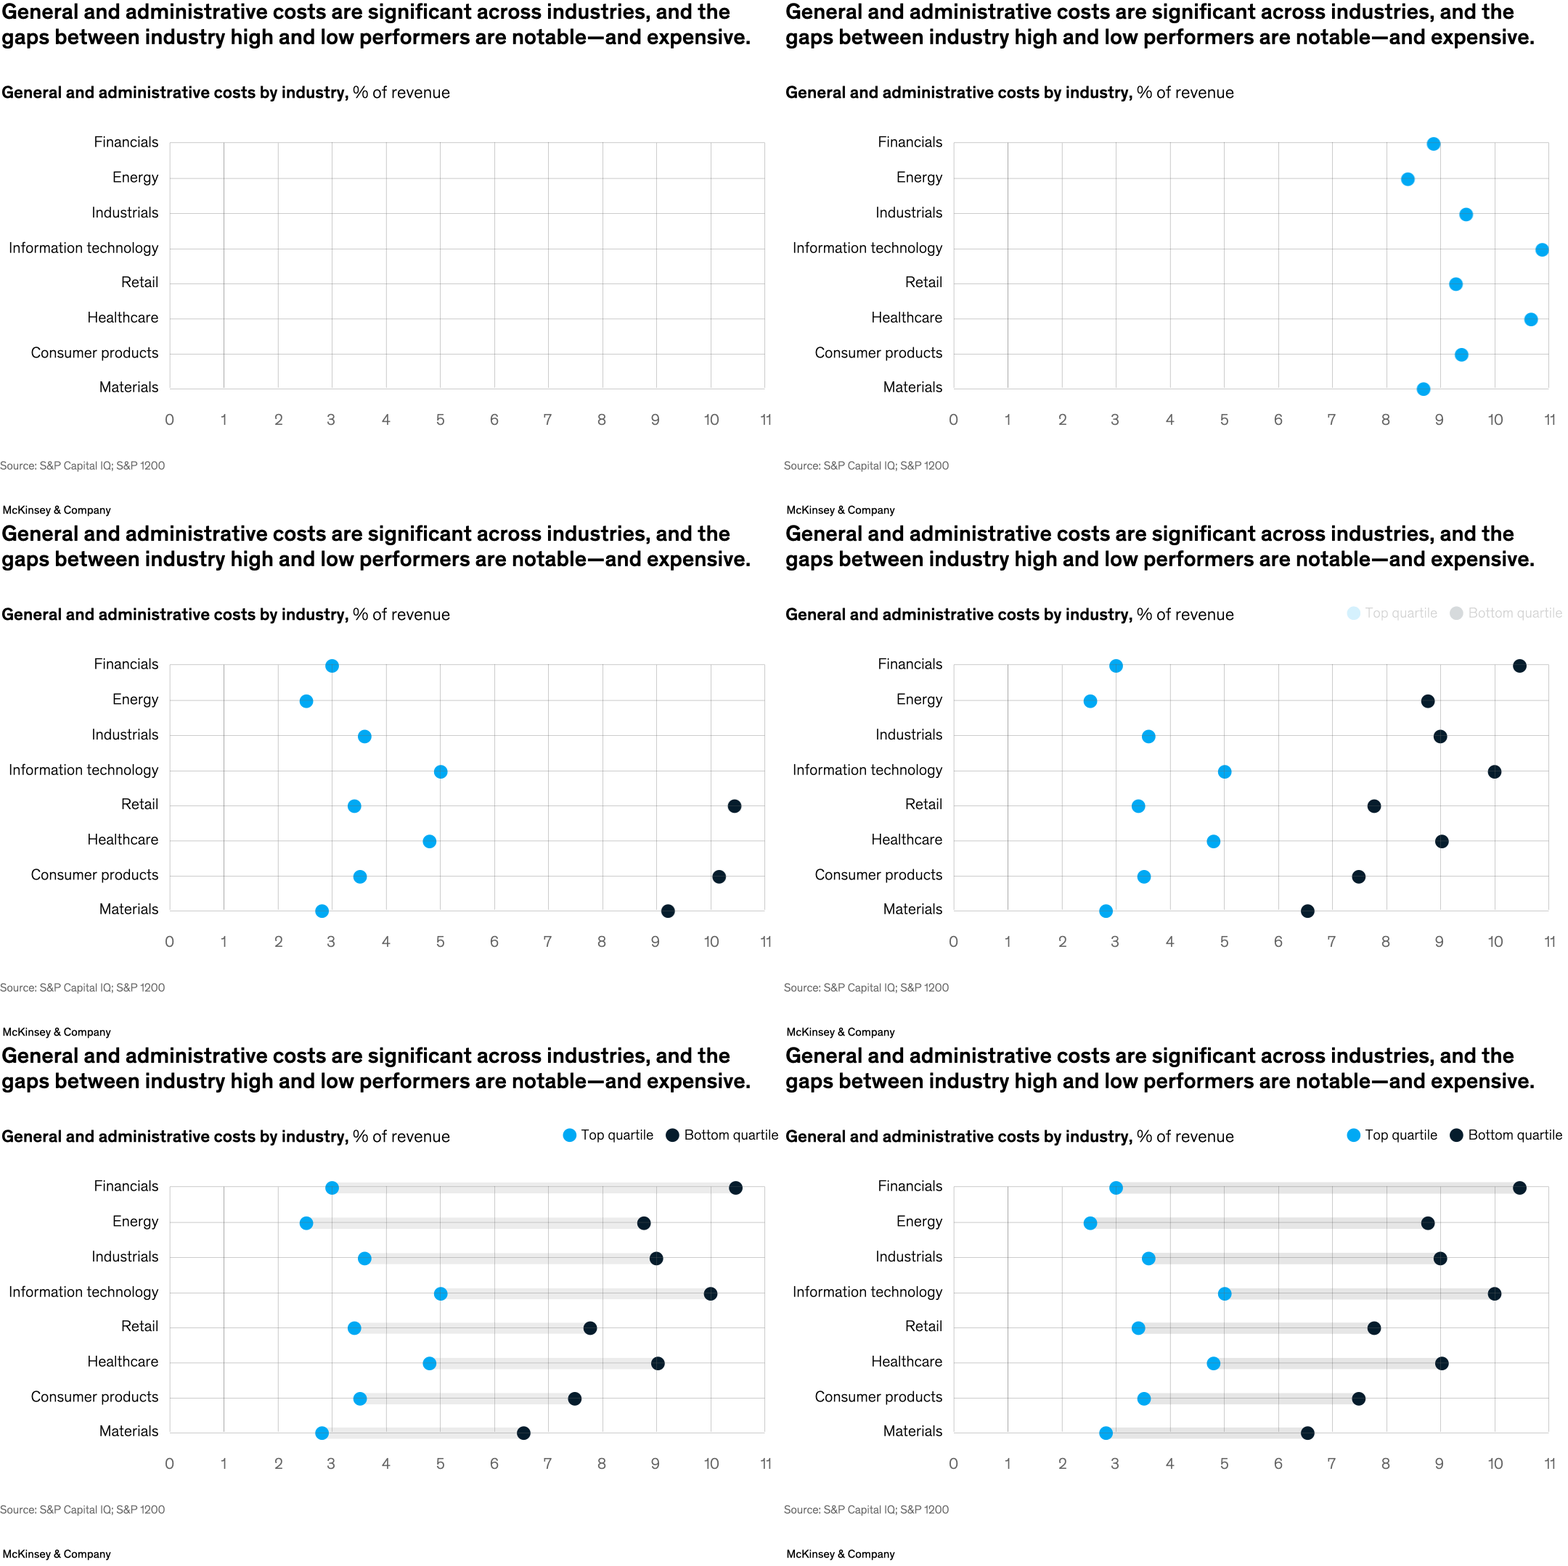
March 24, 2023 – Building and maintaining effective support functions requires significant investment, and can affect how two companies think about value creation when separating. Partner Anna Mattsson and coauthors find that across industries, general and administrative (G&A) costs are significantly lower—4 to 8 percent of revenue—for high performers than those in the bottom quartile.
To read the article, see “The power of goodbye: How carve-outs can unleash value,” February 7, 2023.
customizer here
Visual form
Horizontal dot-and-range chart.
Layout / body structure
The visual is a single horizontal comparison chart read from top to bottom by industry. Each row uses two dots joined by a range bar so the reader can compare a top-quartile performer with a bottom-quartile performer on the same line.
What is being compared
It compares general and administrative costs across eight industries, splitting each industry into top-quartile and bottom-quartile performance groups.
Measurement system
The measure is general and administrative cost as a percent of revenue, so the horizontal position of each dot shows how much of revenue is absorbed by overhead in each performance tier.
Visible structure inside the graphic
Each industry row contains a blue dot for the top quartile and a dark dot for the bottom quartile, connected by a pale horizontal span. The industries are stacked vertically, and the widest gaps appear at the top of the list, where financials and energy show the largest separations.
Main takeaway from the visual
Every industry row shows the top quartile to the left of the bottom quartile, meaning stronger performers run materially leaner administrative cost structures across the board rather than only in a few isolated sectors.
Key standout values or extremes
The financials row sits at roughly 3 percent of revenue for the top quartile versus a little above 10 percent for the bottom quartile. Energy shows a similarly wide spread from roughly 2.5 percent to almost 9 percent, while the narrower ranges lower in the chart still show several points of separation.
Controls / sequence, when applicable
This is a static chart image with no in-chart controls to operate.
Companion media, when applicable
There is no separate companion audio or video; the chart image is the full visual on this page.