Source page: McKinsey & Company
Commentary
Corralling carbon
Asia-Pacific | Decarbonization | Sustainability
March 17, 2023 – Carbon capture, use, and storage (CCUS) could play a significant role in the effort to reach climate goals. The Asia–Pacific region, home to more than 1,300 emitter companies, could represent as much as 55 percent of global CCUS uptake by 2050, find partner Ed Lock and coauthors. Doing so, however, will require the region to boost its current CCUS projects by 450 times.
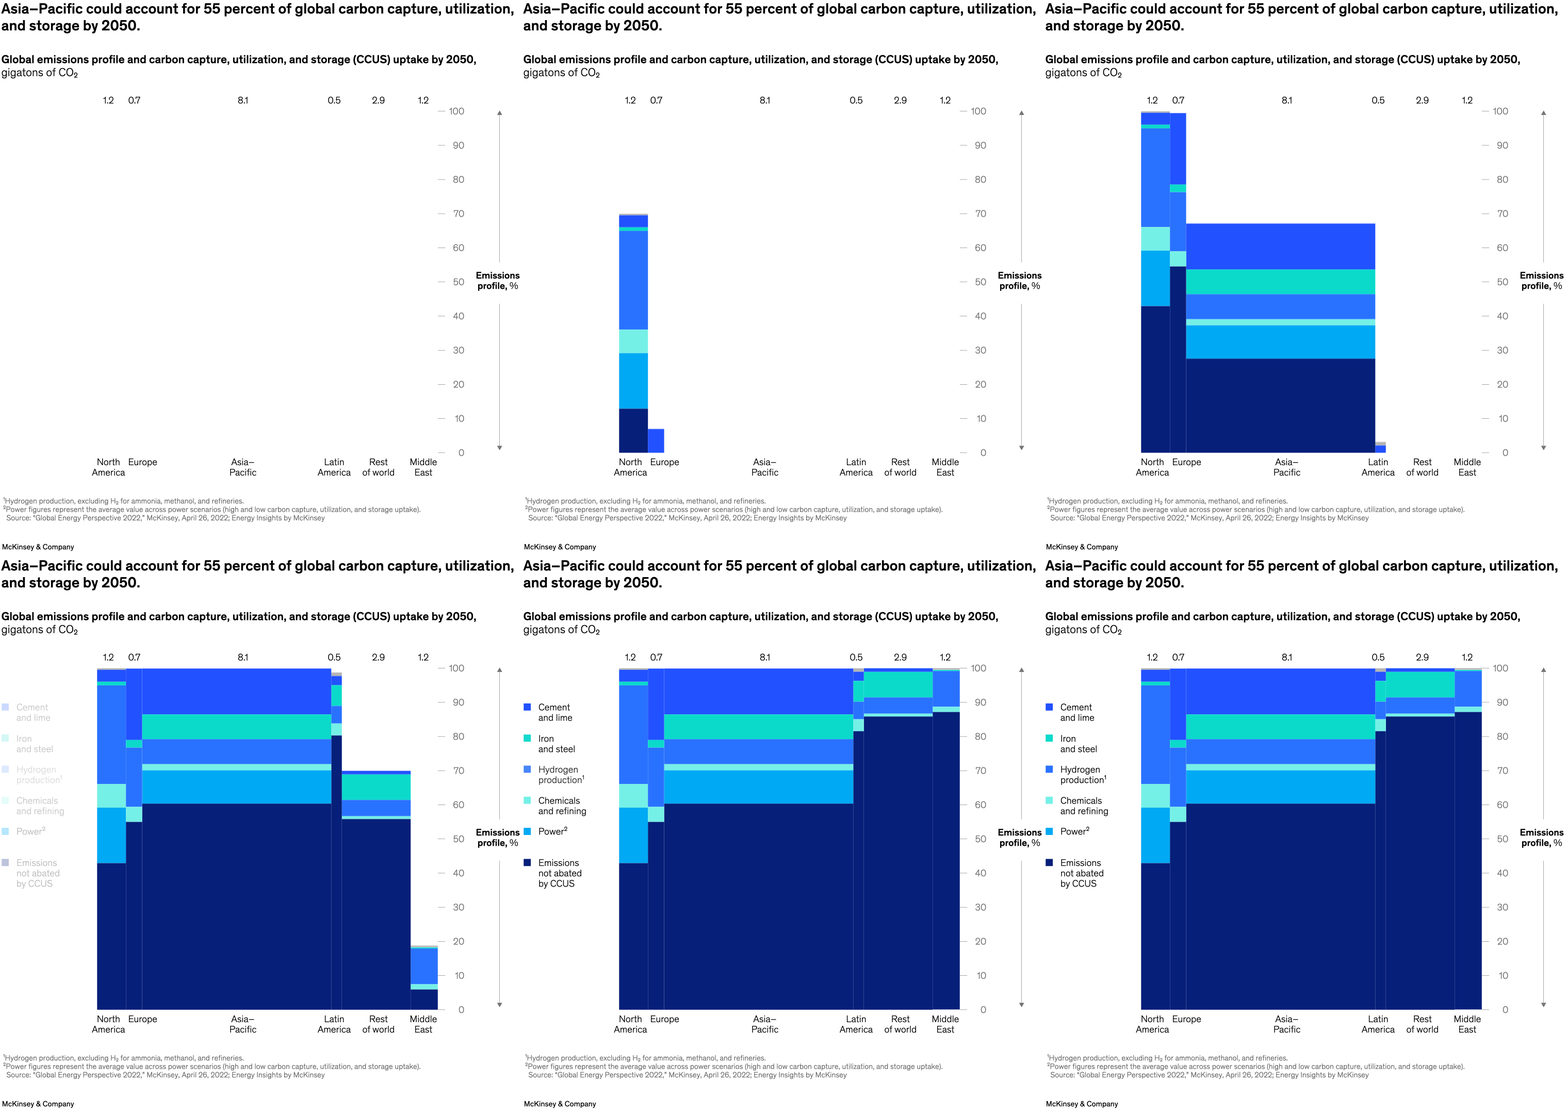
To read the article, see “Unlocking Asia–Pacific’s vast carbon-capture potential,” February 22, 2023.
customizer here
Visual form
Marimekko-style area chart.
Layout / body structure
The visual is one wide matrix-like chart read left to right by region, with each regional column using full height and variable width. Inside each column, horizontal bands break the region into industry segments and the right-side arrow marks the total emissions-profile scale.
What is being compared
It compares projected carbon capture, utilization, and storage uptake by 2050 across global regions and across emitting industries within each region.
Measurement system
Column width represents gigatons of CO2 by region, while the stacked bands inside each column represent the regional emissions-profile mix in percent across industries such as cement and lime, iron and steel, hydrogen production, chemicals and refining, power, and emissions not abated by CCUS.
Visible structure inside the graphic
Each region is one vertical block, with Asia – Pacific far wider than the others. The internal colored bands show how the industry mix changes by region, and the numbers above the columns label the absolute scale of capture potential for each geography.
Main takeaway from the visual
Asia – Pacific dominates the chart by footprint, which makes it immediately visible that the region is expected to carry the largest share of global CCUS uptake. The other regions occupy much narrower columns, so their contribution is materially smaller even before comparing industry mixes.
Key standout values or extremes
Asia – Pacific is labeled 8.1 gigatons of CO2, far above North America at 1.2, Europe at 0.7, Latin America at 0.5, the rest of world at 2.9, and the Middle East at 1.2. The title and column widths together make the region’s 55 percent share of global uptake the dominant figure on the page.
Controls / sequence, when applicable
This is a static chart image with no in-chart controls to operate.
Companion media, when applicable
There is no separate companion audio or video; the chart image is the full visual on this page.