Source page: McKinsey & Company
Commentary
5G buildup
Technology | Telecommunications
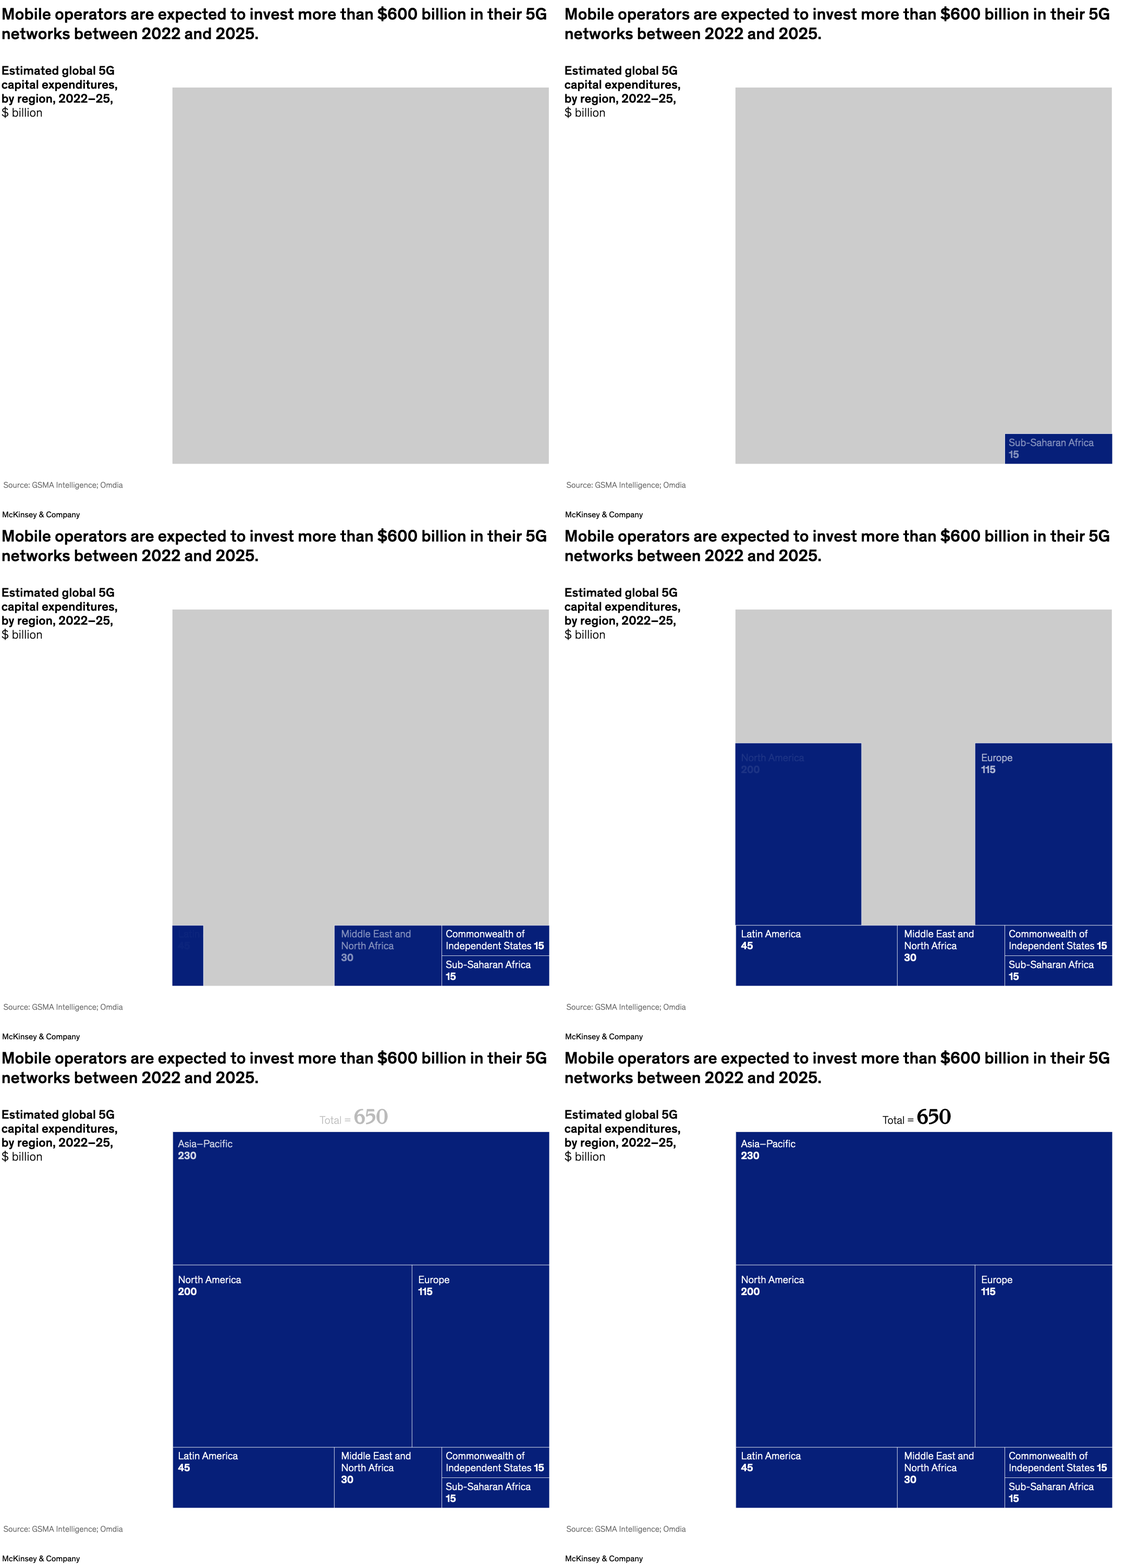
March 15, 2023 – There’s a lot of excitement about—and investment in—5G mobile networks, find senior partner Pallav Jain and colleagues. Telecommunications companies are expected to invest more than $600 billion in 5G infrastructure between 2022–25. But more than keeping gamers happy with faster speeds, telcos can look to position themselves as 5G business builders by focusing on three key areas: core connectivity, premium connectivity, and platforms and solutions.
To read the article, see “Navigating the three horizons of 5G business building,” February 22, 2023.
customizer here
Visual form
Treemap.
Layout / body structure
The visual is one large rectangle divided into regional blocks, so the page reads as a single-field area comparison rather than a time series or multi-panel sequence.
What is being compared
It compares estimated global 5G capital expenditures by region from 2022 to 2025.
Measurement system
The measure is billions of dollars, and each region’s share is encoded by the area of its rectangle rather than by bar height or line position.
Visible structure inside the graphic
Asia – Pacific occupies the largest block at the top, North America fills the next largest block below it, and Europe, Latin America, the Middle East and North Africa, the Commonwealth of Independent States, and sub-Saharan Africa fill progressively smaller blocks around the remaining space. The total of 650 sits above the treemap to anchor the whole field.
Main takeaway from the visual
The treemap concentrates most of the area in Asia – Pacific and North America, showing that global 5G spending is heavily concentrated in those two regions rather than evenly distributed across the world.
Key standout values or extremes
Asia – Pacific is labeled 230 billion dollars, North America 200 billion, and Europe 115 billion. The smallest regions are the Commonwealth of Independent States and sub-Saharan Africa at 15 billion each, with Latin America at 45 and the Middle East and North Africa at 30.
Controls / sequence, when applicable
This is a static chart image with no in-chart controls to operate.
Companion media, when applicable
There is no separate companion audio or video; the chart image is the full visual on this page.