Source page: McKinsey & Company
Commentary
Unpacking ESG product claims
Sustainability | Consumer
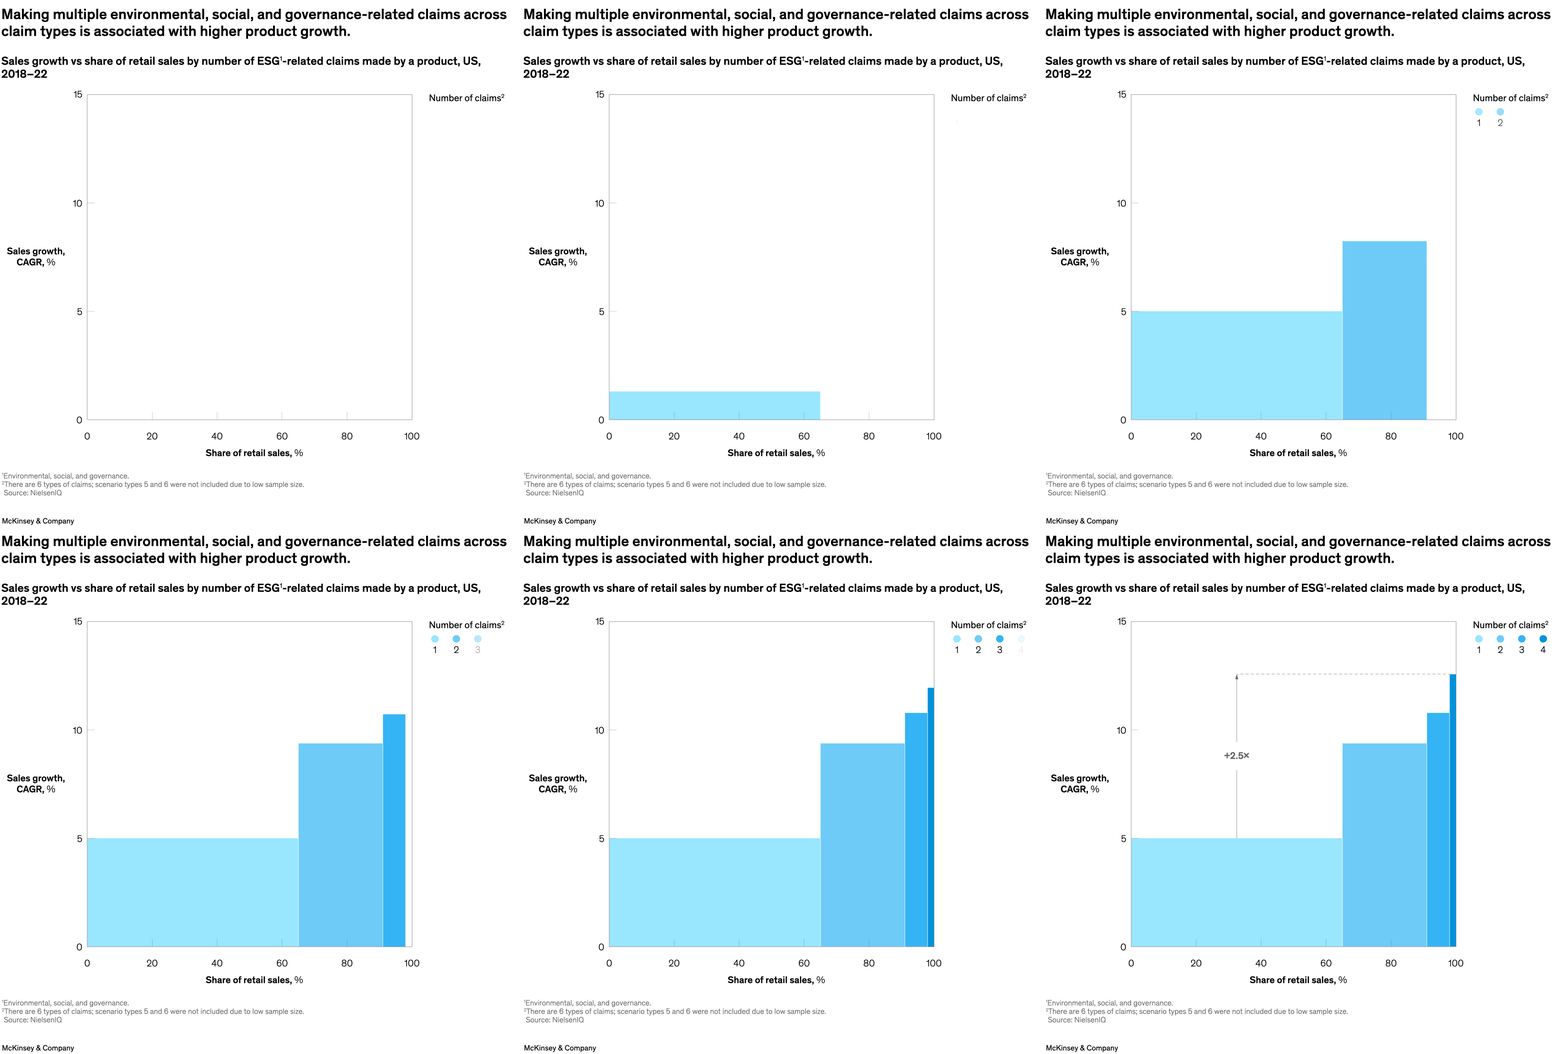
March 3, 2023 – Consumers walk the walk when it comes to spending on products that are backed by environmental, social, and governance (ESG) claims, find senior partner Steve Noble and colleagues. Products containing multiple ESG-related claims on their packaging grew approximately twice as fast as those making only one such claim. It’s crucial, though, that such declarations are backed by genuine ESG impact, such as decarbonization and offering fair wages to employees.
To read the article, see “Consumers care about sustainability—and back it up with their wallets,” February 6, 2023.
customizer here
Visual form
Growth-versus-share block chart.
Layout / body structure
The page uses one chart with share of retail sales on the horizontal axis and sales-growth CAGR on the vertical axis. The visual is built from adjacent colored blocks that step across the x-axis by number of ESG-related claims, with a callout bracket marking the jump in growth.
What is being compared
It compares products grouped by how many ESG-related claims they make and shows how those groups differ in retail-sales share and sales-growth performance.
Measurement system
The x-axis tracks share of retail sales in percent, the y-axis tracks sales-growth CAGR in percent, and the color key identifies products making one, two, three, or four ESG-related claims.
Visible structure inside the graphic
A very wide light-blue block covers most of the retail-sales base at around 5 percent growth, then narrower darker blocks stack toward the right edge and rise higher on the y-axis as the number of claims increases. The +2.5x annotation bracket visually links the lower and higher growth levels.
Main takeaway from the visual
Products with more ESG-related claims are associated with materially faster growth, and the relationship strengthens as the chart steps from one claim to multiple claims. The upward staircase of blocks makes that pattern visible without needing a trend line.
Key standout values or extremes
The broad one-claim block sits around 5 percent CAGR, while the higher-claim groups rise toward roughly 9.5, 10.8, and 12.5 percent at the right edge. The annotation highlights that products with four claims grow about 2.5 times as fast as products with only one claim.
Controls / sequence, when applicable
This is a static chart image with no in-chart controls to operate.
Companion media, when applicable
There is no separate companion audio or video; the chart image is the full visual on this page.