Source page: McKinsey & Company
Commentary
Dollars and planetary sense
Sustainability | Climate change
March 1, 2023 – Climate change is just one sign that humans have put a strain on the planet. According to the findings of senior partner Hamid Samandari and coauthors, human activity has pushed the Earth beyond a safe operating space in at least four areas: biodiversity loss, chemical and plastic pollution, nutrient pollution, and greenhouse-gas emissions. Practices such as regenerative agriculture and reducing food waste, among other measures, would not only give the planet a lifeline—they could provide a positive return on investment for companies.
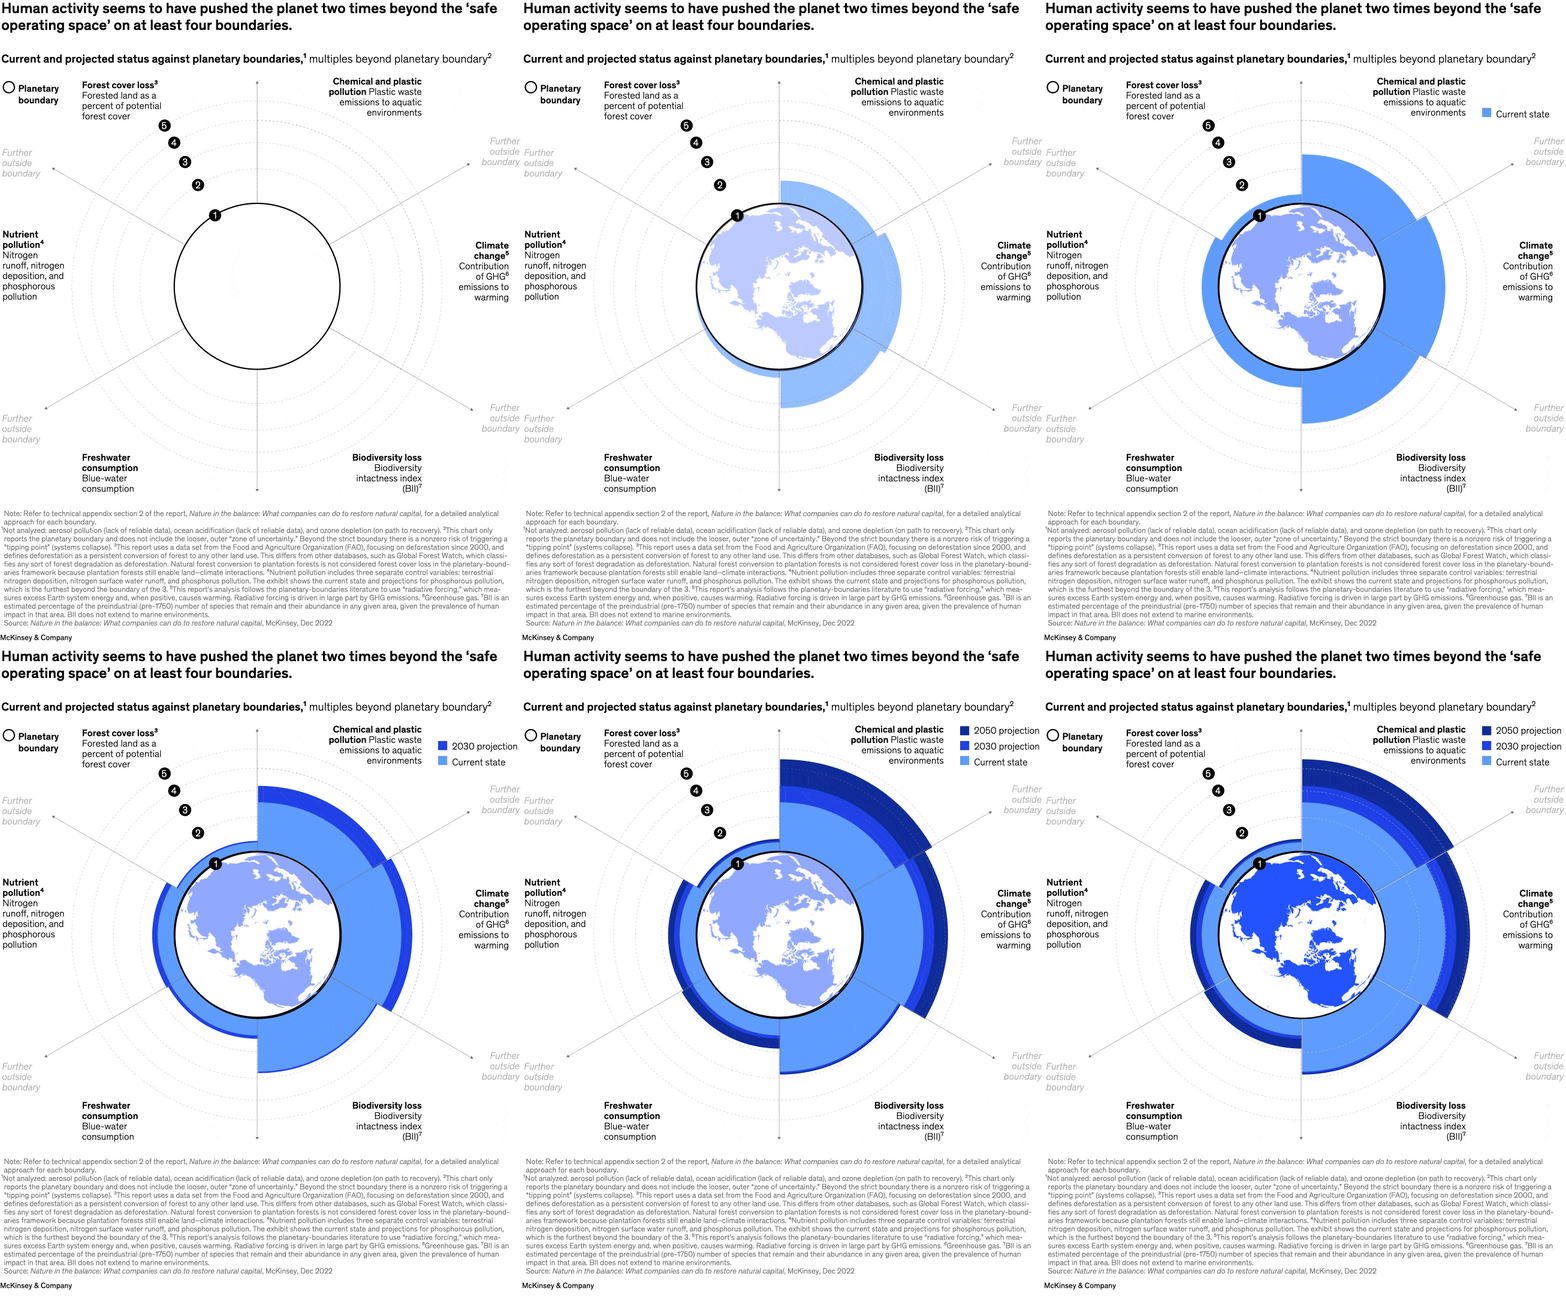
To read the report, see “Nature in the balance: What companies can do to restore natural capital,” December 5, 2022.
customizer here
Visual form
Radial boundary chart.
Layout / body structure
The page is organized around a central globe with six wedges radiating outward for different planetary boundaries. Each wedge shows three nested bands for current state, 2030 projection, and 2050 projection, so the reader moves around the circle and then outward from the center to see how far beyond the boundary each measure extends.
What is being compared
It compares six environmental boundaries: chemical and plastic pollution, climate change, biodiversity loss, freshwater consumption, nutrient pollution, and forest cover loss.
Measurement system
The measure is multiples beyond the planetary boundary, displayed on concentric rings that run from 1 to 5 times the safe operating limit.
Visible structure inside the graphic
Each boundary is a wedge extending from the globe, with progressively darker outer bands showing the current state and the 2030 and 2050 projections. Arrows on both sides mark the idea of moving further outside the boundary, and the uneven wedge lengths make it easy to see which environmental stresses extend farthest.
Main takeaway from the visual
Human activity has already pushed every boundary on the chart beyond the safe zone, and several of them stretch much farther by 2030 and 2050. Chemical and plastic pollution and climate change are among the most visually extended wedges, so the chart reads as broad overshoot rather than a single isolated problem.
Key standout values or extremes
By 2050, chemical and plastic pollution reaches roughly 4.5 times the boundary, climate change roughly 4.0, biodiversity loss roughly 3.0, freshwater consumption roughly 2.0, nutrient pollution roughly 1.8, and forest cover loss about 1.4.
Controls / sequence, when applicable
This is a static chart image with no in-chart controls to operate.
Companion media, when applicable
There is no separate companion audio or video; the chart image is the full visual on this page.