Source page: McKinsey & Company
Commentary
Infotainment superhighway
Automotive | Mobility
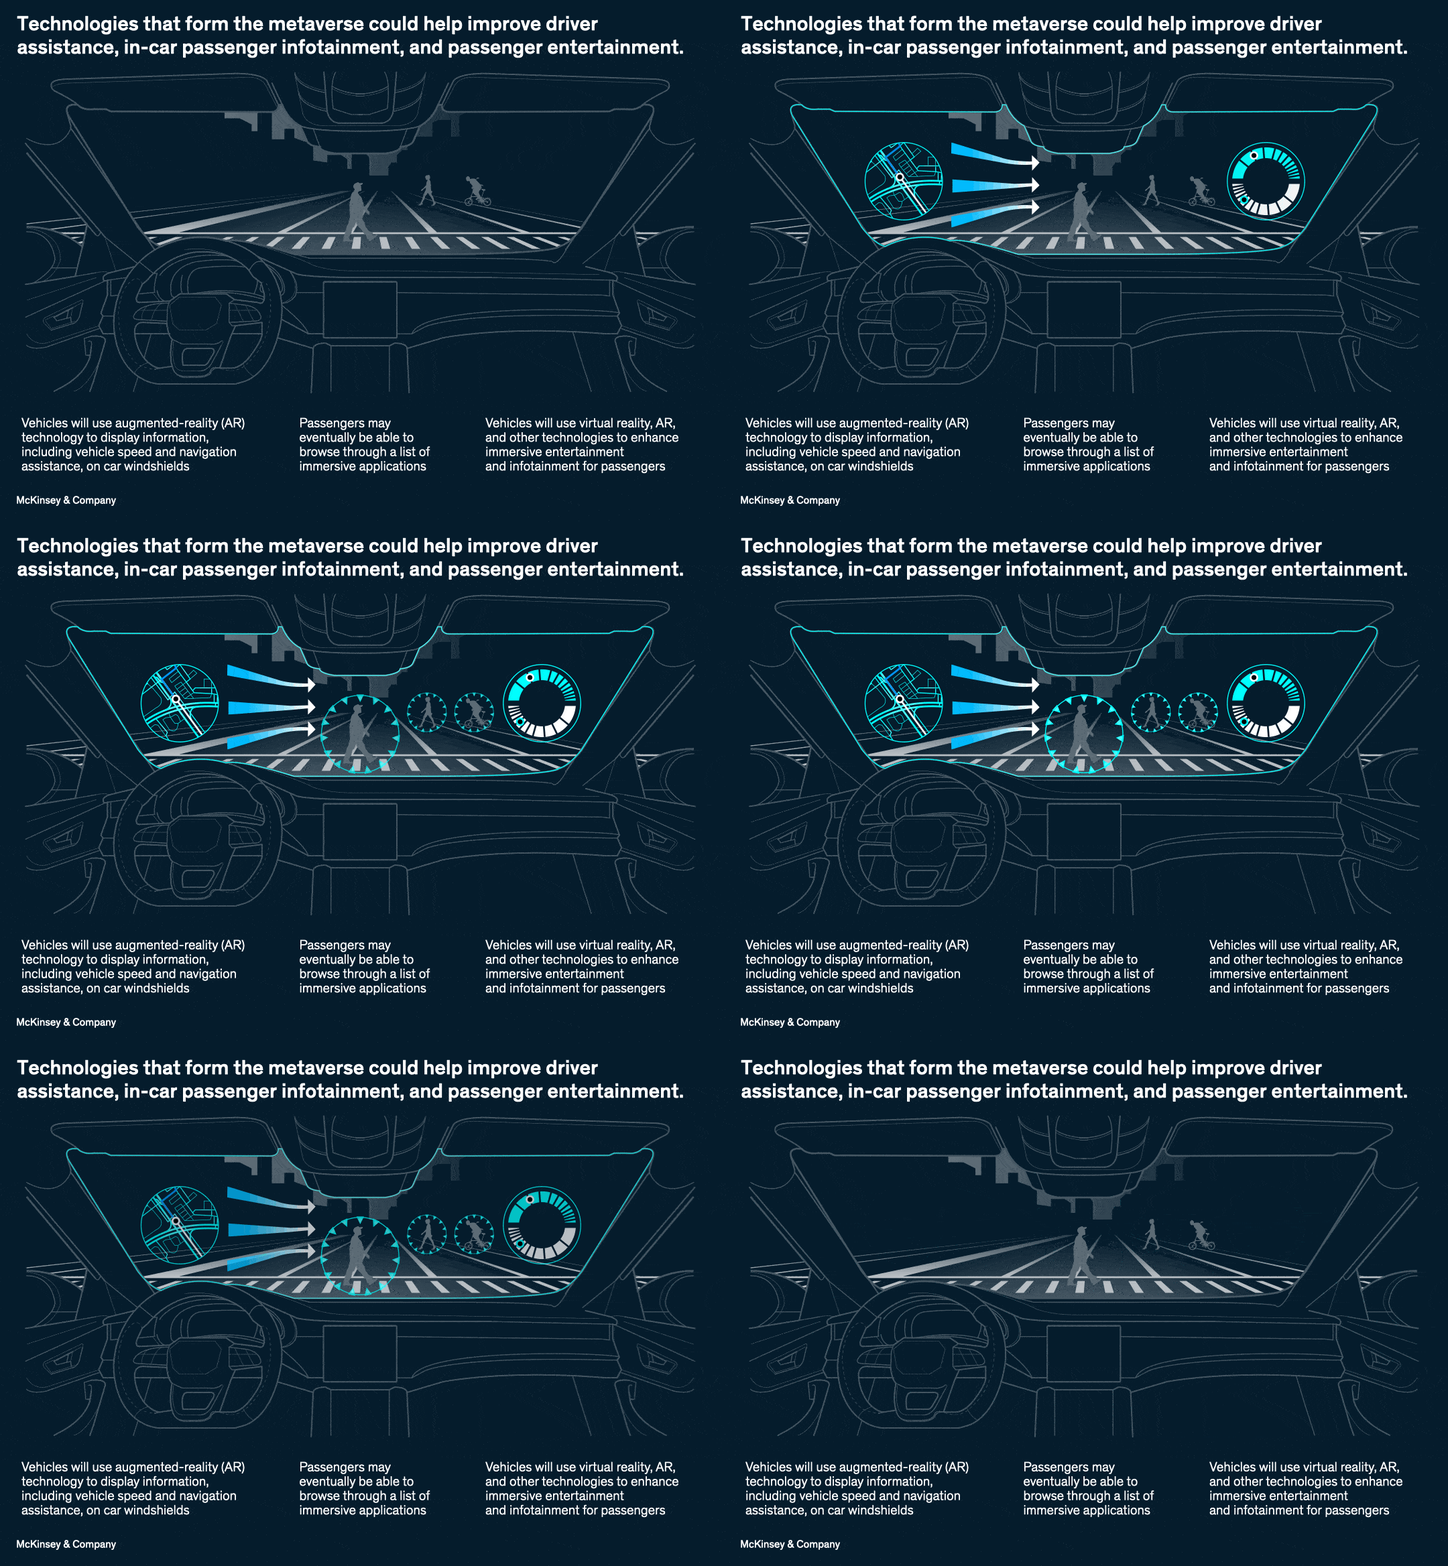
February 6, 2023 – Mobility sector stakeholders see opportunities to capture value from the metaverse, even before the digital world fully materializes. Partner Kersten Heineke and coauthors found that in-car entertainment could generate more than $30 billion in value by 2030. Tech firms and OEMs are using spatial computing along with virtual and augmented reality to, for instance, display navigation and approaching road hazards on the windshield. Passengers could someday use metaverse tools to browse immersive applications and infotainment options inside vehicles.
To read the article, see “The metaverse: Driving value in the mobility sector,” January 4, 2023.
customizer here
Visual form
Animated multi-panel image sequence.
Layout / body structure
The chart reads as a timed sequence of metaverse use cases inside and around the vehicle cabin rather than as one fixed axis chart. The visual advances panel by panel through driver-assistance, in-car infotainment, and passenger-entertainment applications, so the reading order is left to right within each frame and then forward through the sequence.
What is being compared
It compares the main mobility use cases where metaverse-style technologies can create value, with the emphasis on driver assistance, in-car information and navigation, and passenger entertainment.
Measurement system
The page mixes categorical use-case labels with value-pool framing in dollars, especially the 2030 opportunity attached to in-car entertainment. Labels and callouts do more of the measuring work than a conventional axis.
Visible structure inside the graphic
The sequence is organized around a vehicle-centered illustration with use-case callouts layered onto specific parts of the driving or riding experience. The major internal pieces are the separate application panels, the callout labels tied to those applications, and the highlighted value note attached to the entertainment opportunity.
Main takeaway from the visual
The sequence makes the cabin itself look like the main monetization space. Driver-facing and passenger-facing digital layers both matter, but the passenger-entertainment applications are presented as the clearest value pool in the chart.
Key standout values or extremes
The most explicit value marker on the page is the statement that in-car entertainment could generate more than 30 billion dollars in value by 2030. The rest of the sequence works more through the spread of use cases than through a long list of numeric labels.
Controls / sequence, when applicable
This is a static chart image with no in-chart controls to operate.
Companion media, when applicable
There is no separate companion audio or video; the chart image is the full visual on this page.