Source page: McKinsey & Company
Commentary
The impact of commodity prices in Africa
Africa | Inflation
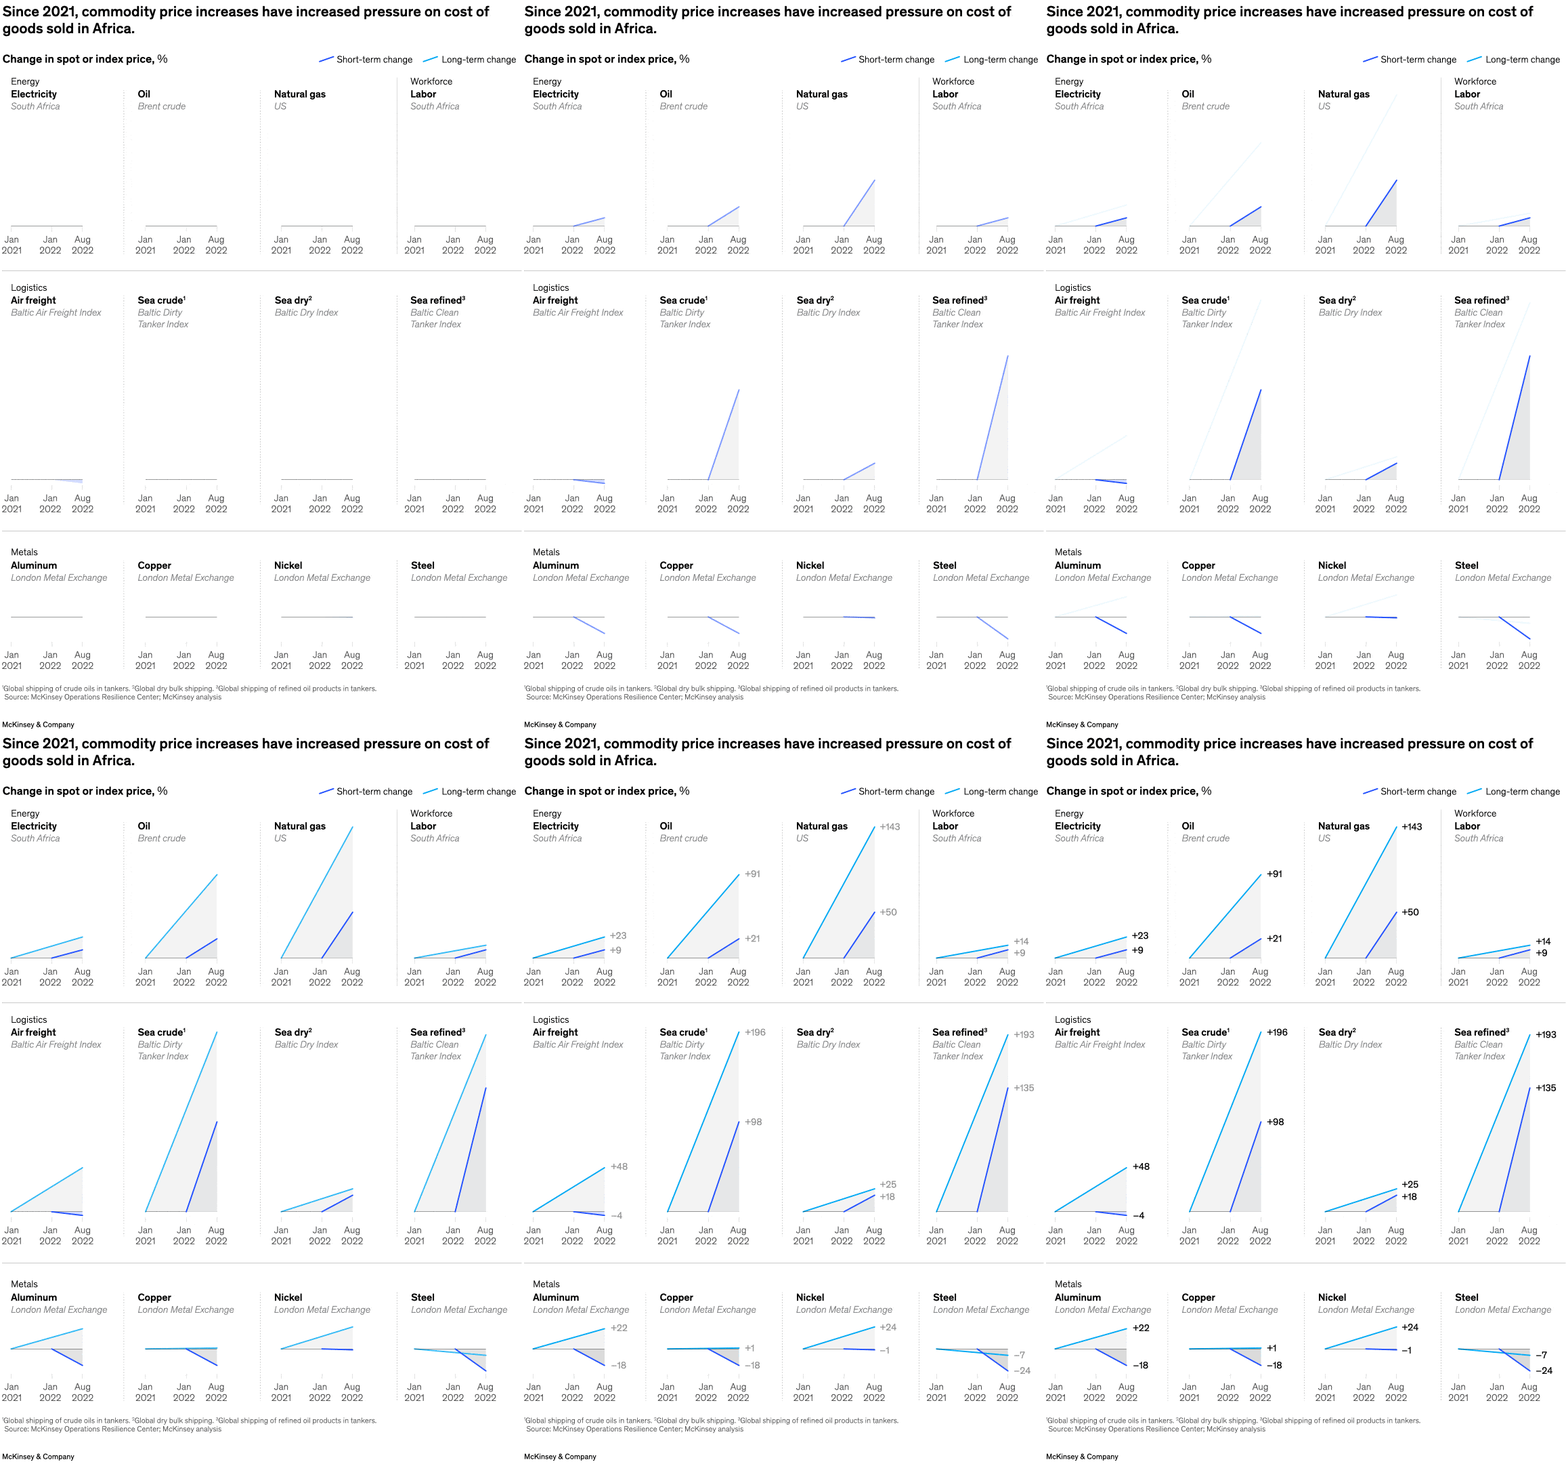
January 31, 2023 – From energy and labor to logistics and metals, commodity price increases have greatly impacted the cost of goods sold (COGS) in Africa, say senior partner Marco Ziegler and coauthors. Energy-intensive sectors—including oil and gas as well as mining—have seen 10 to 20 percent COGS increases since mid-2021.
To read the article, see “Procurement in Africa: Exercising a muscle for challenging times,” December 1, 2022.
customizer here
Visual form
Sector comparison bar chart.
Layout / body structure
The chart is structured as a single sector-by-sector comparison, with the main chart occupying the center of the page and the explanatory note beneath it. Reader scans across industries to see where cost pressure is most severe.
What is being compared
It compares how commodity-price increases have affected the cost of goods sold across sectors in Africa, with special attention to energy-intensive industries such as oil and gas and mining.
Measurement system
The measurement is the percentage increase in cost of goods sold since mid-2021. Sector labels identify the rows or columns, and the bar lengths or ranges show how much commodity inflation has raised cost pressure in each case.
Visible structure inside the graphic
The chart is organized around sector labels and a set of bars or ranges showing the level of cost pressure attached to each one. The internal structure is simple and comparative: industry names on one side, magnitude markers on the other, and a visual emphasis on the most exposed sectors.
Main takeaway from the visual
The page shows that rising commodity prices are not hitting every sector evenly. Energy-intensive and extractive sectors stand out as the areas where the cost shock is heaviest and most immediate.
Key standout values or extremes
The article framing and chart summary point to cost-of-goods-sold increases of roughly 10 to 20 percent in sectors such as oil and gas and mining since mid-2021. Those sectors sit at the heavy end of the chart’s comparison.
Controls / sequence, when applicable
This is a static chart image with no in-chart controls to operate.
Companion media, when applicable
There is no separate companion audio or video; the chart image is the full visual on this page.