Source page: McKinsey & Company
Commentary
Inclusion in action
Diversity & Inclusion | Strategy
January 20, 2023 – Davos—the World Economic Forum’s annual meeting—is in full swing through January 20. All this week, our daily charts will focus on some of the key themes of the event, including resilience, sustainability, reimagining globalization, inclusion, and space. For more, see “McKinsey and the World Economic Forum 2023.”
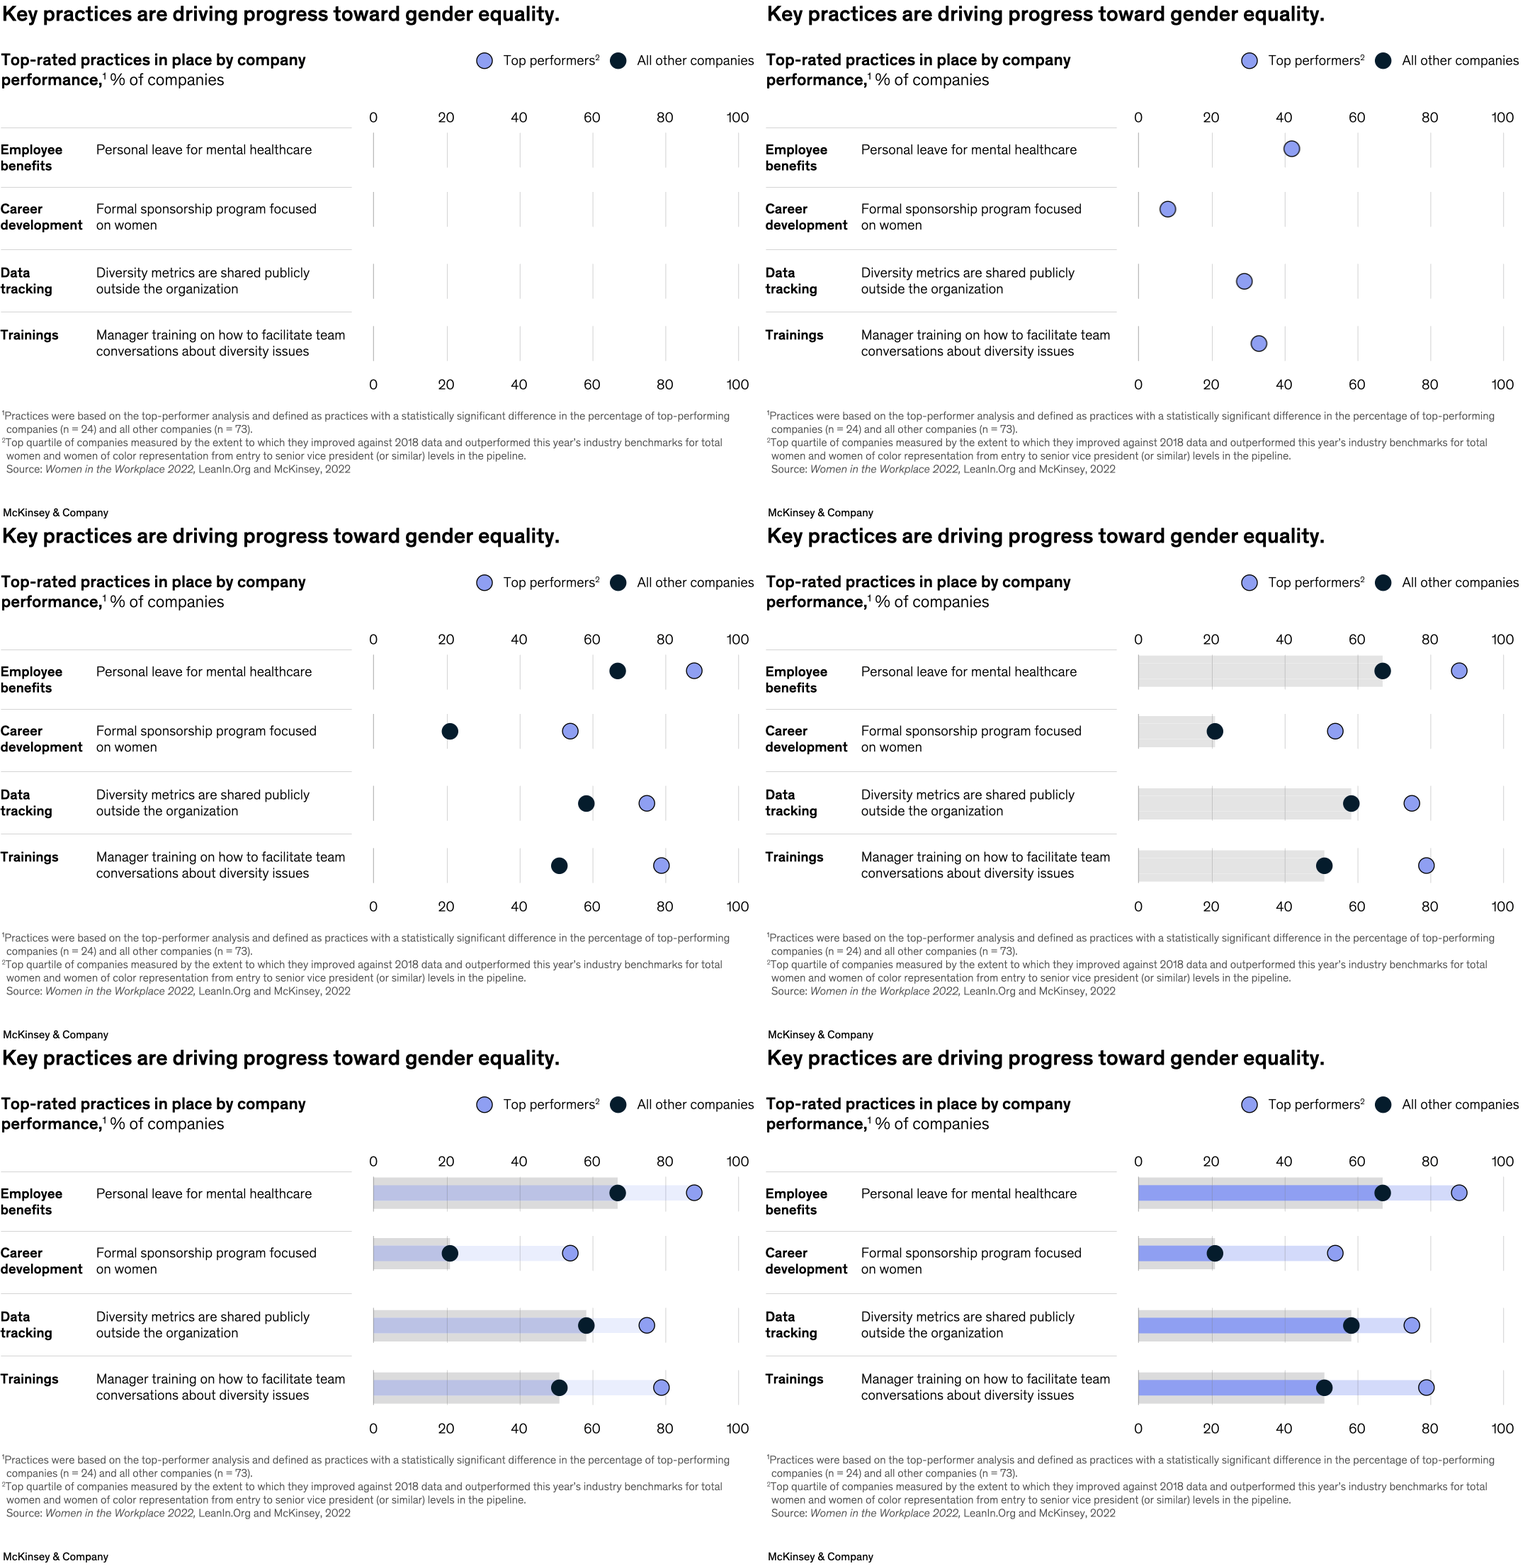
Companies make strides toward gender equality when they offer specific and actionable policies along with equitable benefits, McKinsey’s Women in the Workplace report with LeanIn.Org shows. Senior partners Alexis Krivkovich and Lareina Yee and coauthors found that organizations offering practices such as personal leave for mental healthcare and management-training programs aimed at diversity issues had higher levels of representation of women and women of color.
To read the report, see “Women in the Workplace 2022,” October 18, 2022.
customizer here
Visual form
Grouped bar chart.
Layout / body structure
The chart is laid out as a practice-by-practice comparison, with each group showing how representation outcomes differ when a company adopts a specific inclusion practice. Reader moves across the practice categories and compares the paired bars within each group.
What is being compared
It compares organizations that offer concrete inclusion measures, such as mental-health leave and diversity-focused management training, with those that do less, and links those differences to representation outcomes for women and women of color.
Measurement system
The page uses representation levels and shares rather than dollar values. Grouped category labels define the practices, and the bar heights show how strongly each practice lines up with better gender-equality outcomes.
Visible structure inside the graphic
The internal structure comes from repeated bar groups arranged around specific workplace practices. Each group separates the inclusion actions from the representation outcomes, so the visual logic is practice first and progress second.
Main takeaway from the visual
The chart is built to show that gender-equality progress is associated with specific managerial and policy choices rather than with vague intent. The companies using targeted practices visibly outperform the ones that do not.
Key standout values or extremes
The strongest emphasis falls on tangible practices such as personal leave for mental healthcare and management training focused on diversity issues. Those categories are the ones the page ties most directly to better representation of women and women of color.
Controls / sequence, when applicable
This is a static chart image with no in-chart controls to operate.
Companion media, when applicable
There is no separate companion audio or video; the chart image is the full visual on this page.