Source page: McKinsey & Company
Commentary
Higher learning
Education | Investing
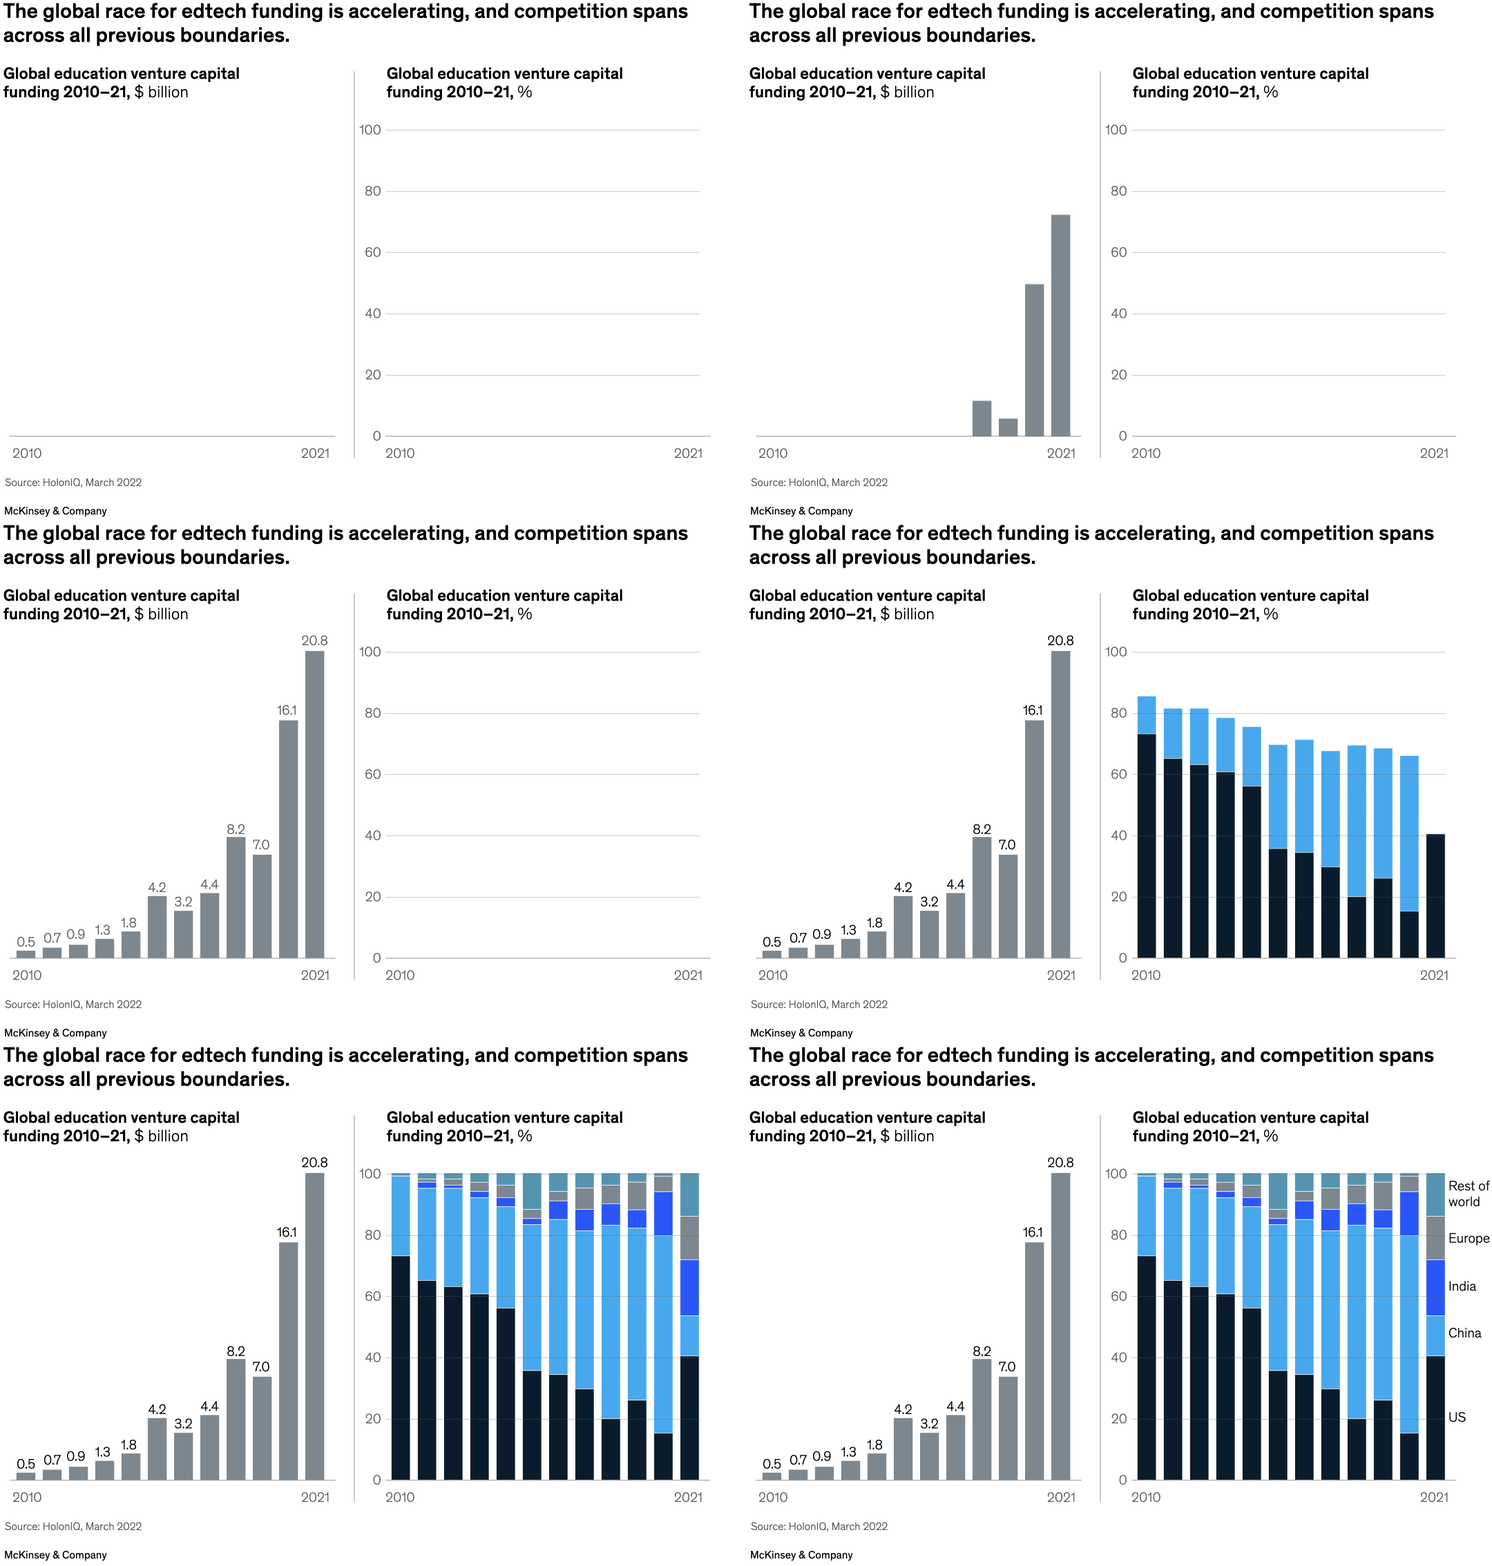
January 11, 2023 – The education-to-employment sector that serves adult learners has the attention of venture capitalists—dozens of “unicorn” edtech start-ups have valuations of more than $1 billion, note McKinsey partner Saurabh Sanghvi and coauthor. In 2010, most of the $500 million in global venture capital funding in the sector went to US-based firms. Now, funding for edtech has climbed to nearly $21 billion, with China, India, and other parts of the world grabbing larger shares.
To read the article, see “Five trends to watch in the edtech industry,” November 14, 2022.
customizer here
Visual form
Funding-growth chart with regional breakout.
Layout / body structure
The page presents the edtech funding story as a growth comparison over time and across geographies. Reader first sees the escalation in total venture funding and then reads the regional spread that turns the sector into a global race rather than a US-only story.
What is being compared
It compares venture-capital funding in the adult-learning edtech sector over time and across regions, showing how the geography of funding has broadened as the market has scaled.
Measurement system
The main unit is venture-capital funding in dollars, with the chart using year or period markers and regional categories to show how the market has expanded.
Visible structure inside the graphic
The internal structure combines a time progression in total funding with a regional distribution layer that shows where the capital is going. The result is a chart that reads both as a rising funding curve and as a widening competitive map.
Main takeaway from the visual
The chart shows that adult-learning edtech is no longer a niche or narrowly American funding story. Capital has scaled sharply and spread geographically, which is why the chart reads as a global competition for category leadership.
Key standout values or extremes
The page frames the market as rising from about 500 million dollars in global venture funding in 2010 to nearly 21 billion dollars more recently. That jump is the clearest quantitative anchor in the graphic.
Controls / sequence, when applicable
This is a static chart image with no in-chart controls to operate.
Companion media, when applicable
There is no separate companion audio or video; the chart image is the full visual on this page.