Source page: McKinsey & Company
Commentary
Follow the tech dollars
Resilience | Economy
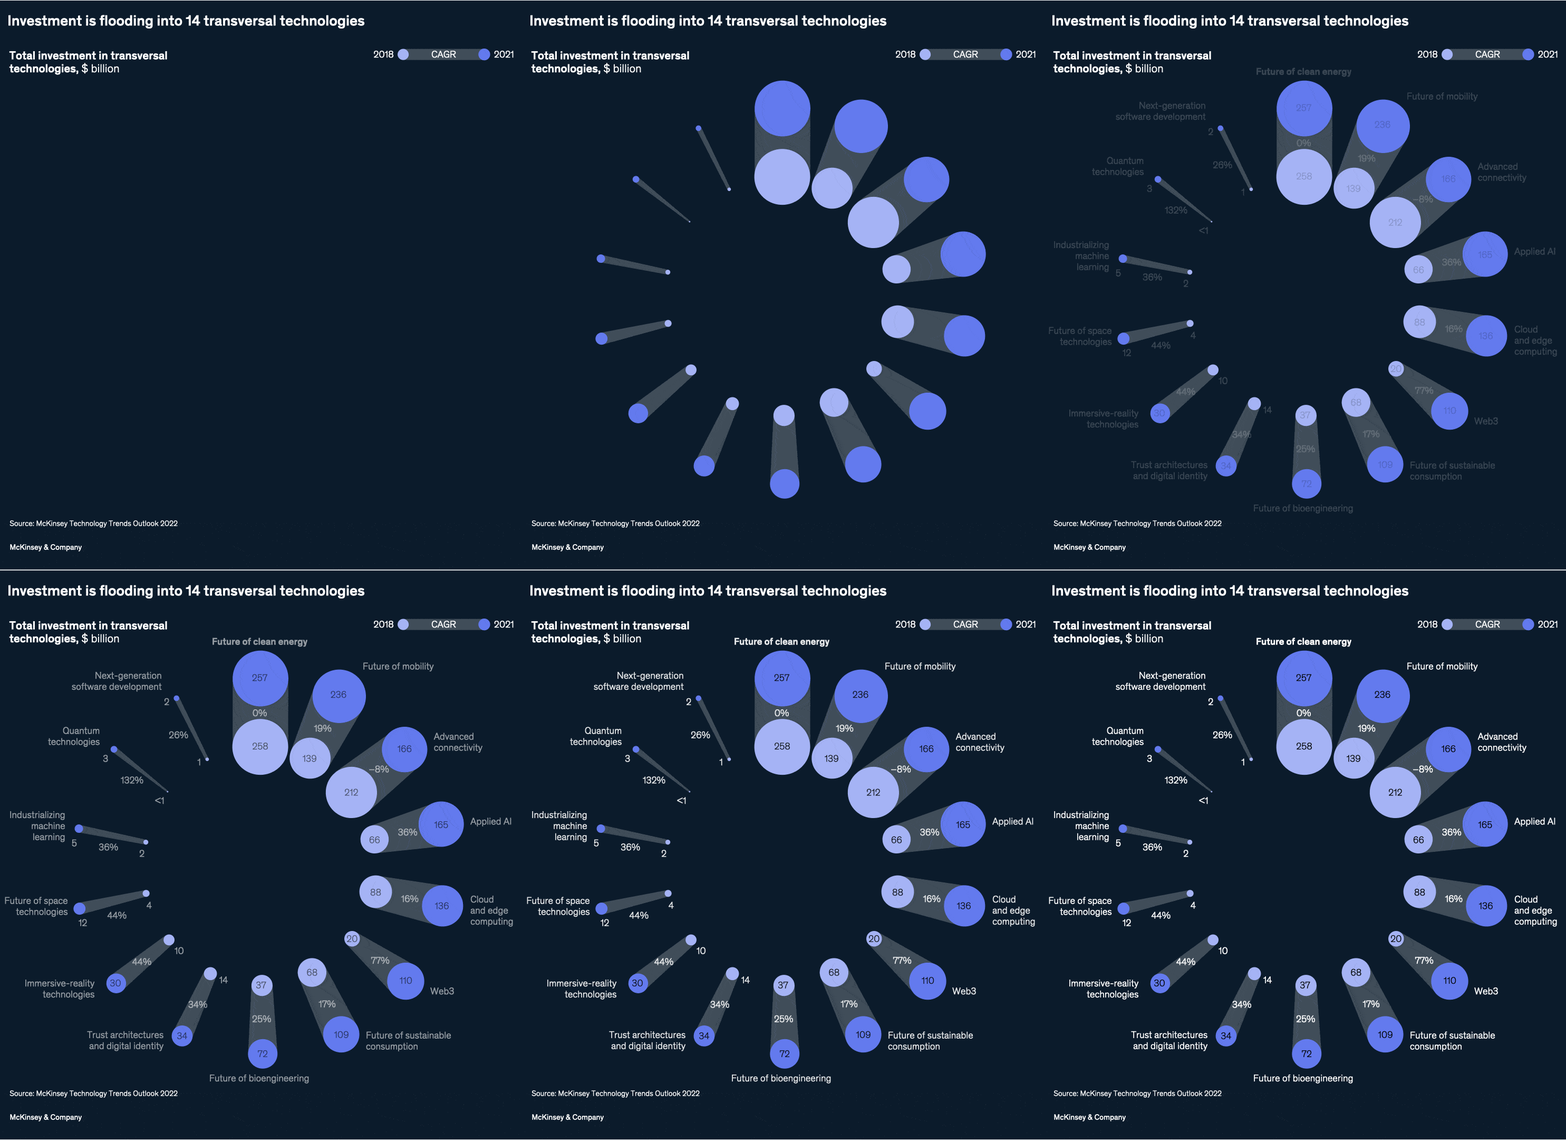
December 19, 2022 – A look at where technology investment is going could provide a glimpse of what the future of business and society looks like. A recent paper by senior partner Sven Smit and coauthors points out 14 “transversal technologies”—technologies that spread across sectors—that, in some cases, are attracting tens or hundreds of billions of dollars of annual investment. Technologies including applied AI, bioengineering, and immersive-reality have seen double-digit investment growth rates.
To read the paper, see “On the cusp of a new era?” October 20, 2022.
customizer here
Visual form
Ranked investment chart.
Layout / body structure
The page uses a ranked category comparison, with the technologies arranged so the largest or fastest-funded areas stand out first. Reader scans down the list of transversal technologies to compare where the most capital is flowing.
What is being compared
It compares investment flowing into 14 transversal technologies, including applied AI, bioengineering, cloud and edge computing, and other technologies that cut across multiple sectors.
Measurement system
The main unit is annual investment in dollars, with the chart using category labels and bar lengths or a similar ranking device to show relative scale.
Visible structure inside the graphic
The internal structure is built from one technology category per row or bar, with the largest investment pools visually separated from the smaller ones. The ordered arrangement makes the funding hierarchy easy to read.
Main takeaway from the visual
The page shows that capital is concentrating in a relatively small set of technologies that have cross-sector effects. The ranking makes the future look shaped by a handful of broad platforms rather than by isolated niche bets.
Key standout values or extremes
The headline visual fact is that investment is flooding into all 14 transversal technologies, and that some of them are already attracting tens or even hundreds of billions of dollars annually. The highest-funded technologies occupy the top end of the ranking.
Controls / sequence, when applicable
This is a static chart image with no in-chart controls to operate.
Companion media, when applicable
There is no separate companion audio or video; the chart image is the full visual on this page.