Source page: McKinsey & Company
Commentary
Money side up
Financial services | Payments
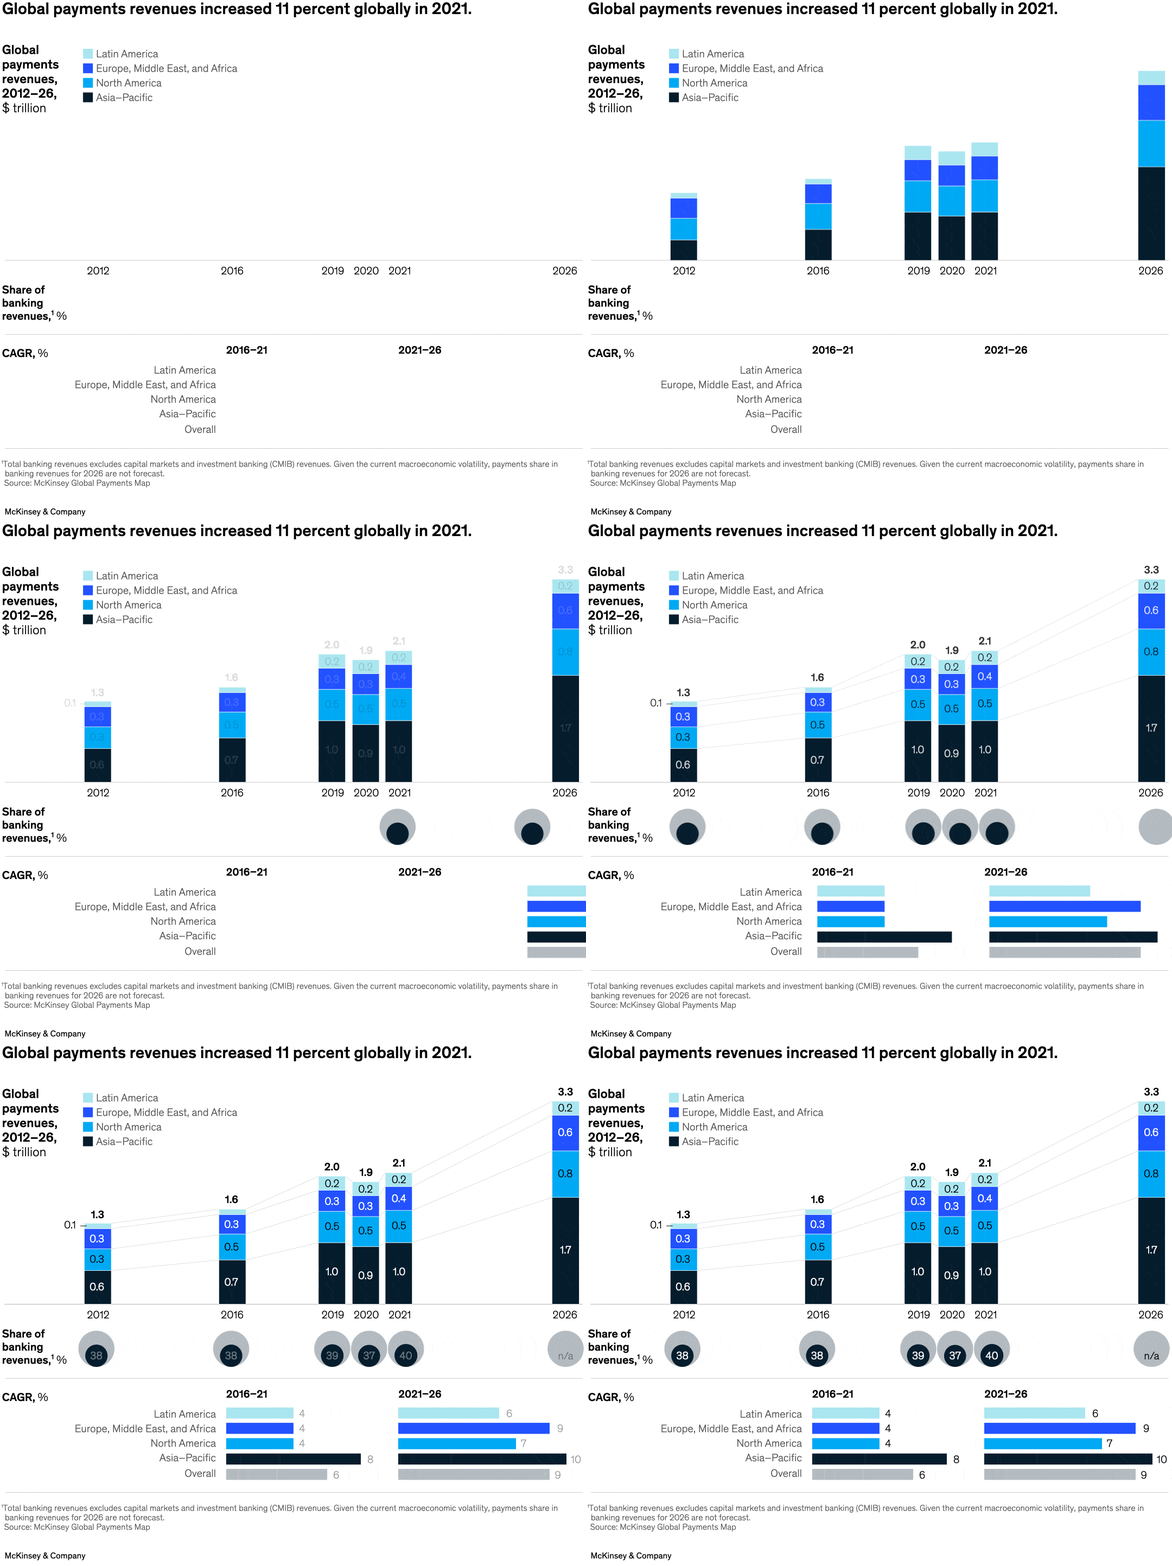
December 7, 2022 – Revenues in the global payments industry that eroded in 2020, the first full year of the pandemic, were recouped—and then some—in 2021, growing at 11 percent and pushing revenue projections to $3 trillion by 2026. Partner Philip Bruno and coauthors found that overall revenue growth averaged 3 percent during the past two years, surpassing more pessimistic predictions.
To read the article, see “The chessboard rearranged: Rethinking next moves in global payments,” October 7, 2022.
customizer here
Visual form
Time-series revenue chart.
Layout / body structure
The page uses a single historical-and-forward revenue view, so the reader follows the payments-revenue path from the pandemic dip into the rebound and then into the projection period. The reading order is left to right through the years.
What is being compared
It compares global payments-industry revenues across the pandemic downturn, the 2021 rebound, and the forward outlook toward 2026.
Measurement system
The key measures are annual revenue growth rates and total industry revenue in dollars, with the projection extending toward a 3 trillion dollar market by 2026.
Visible structure inside the graphic
The graphic is organized around the revenue trend line or bars over time, with annotations marking the pandemic drop and the subsequent recovery. The internal structure is temporal, with the rebound year and forward target doing the heaviest lifting.
Main takeaway from the visual
The chart shows that the payments industry did more than recover lost ground. The rebound after the pandemic dip is strong enough that the graphic reads as a reset to a larger growth path rather than just a return to the old baseline.
Key standout values or extremes
The page highlights an 11 percent increase in global payments revenues in 2021. It also frames the longer runway around a projected 3 trillion dollars in revenue by 2026 and notes that average growth over the past two years was 3 percent.
Controls / sequence, when applicable
This is a static chart image with no in-chart controls to operate.
Companion media, when applicable
There is no separate companion audio or video; the chart image is the full visual on this page.