Source page: McKinsey & Company
Commentary
Cost concerns
Economy | Inflation
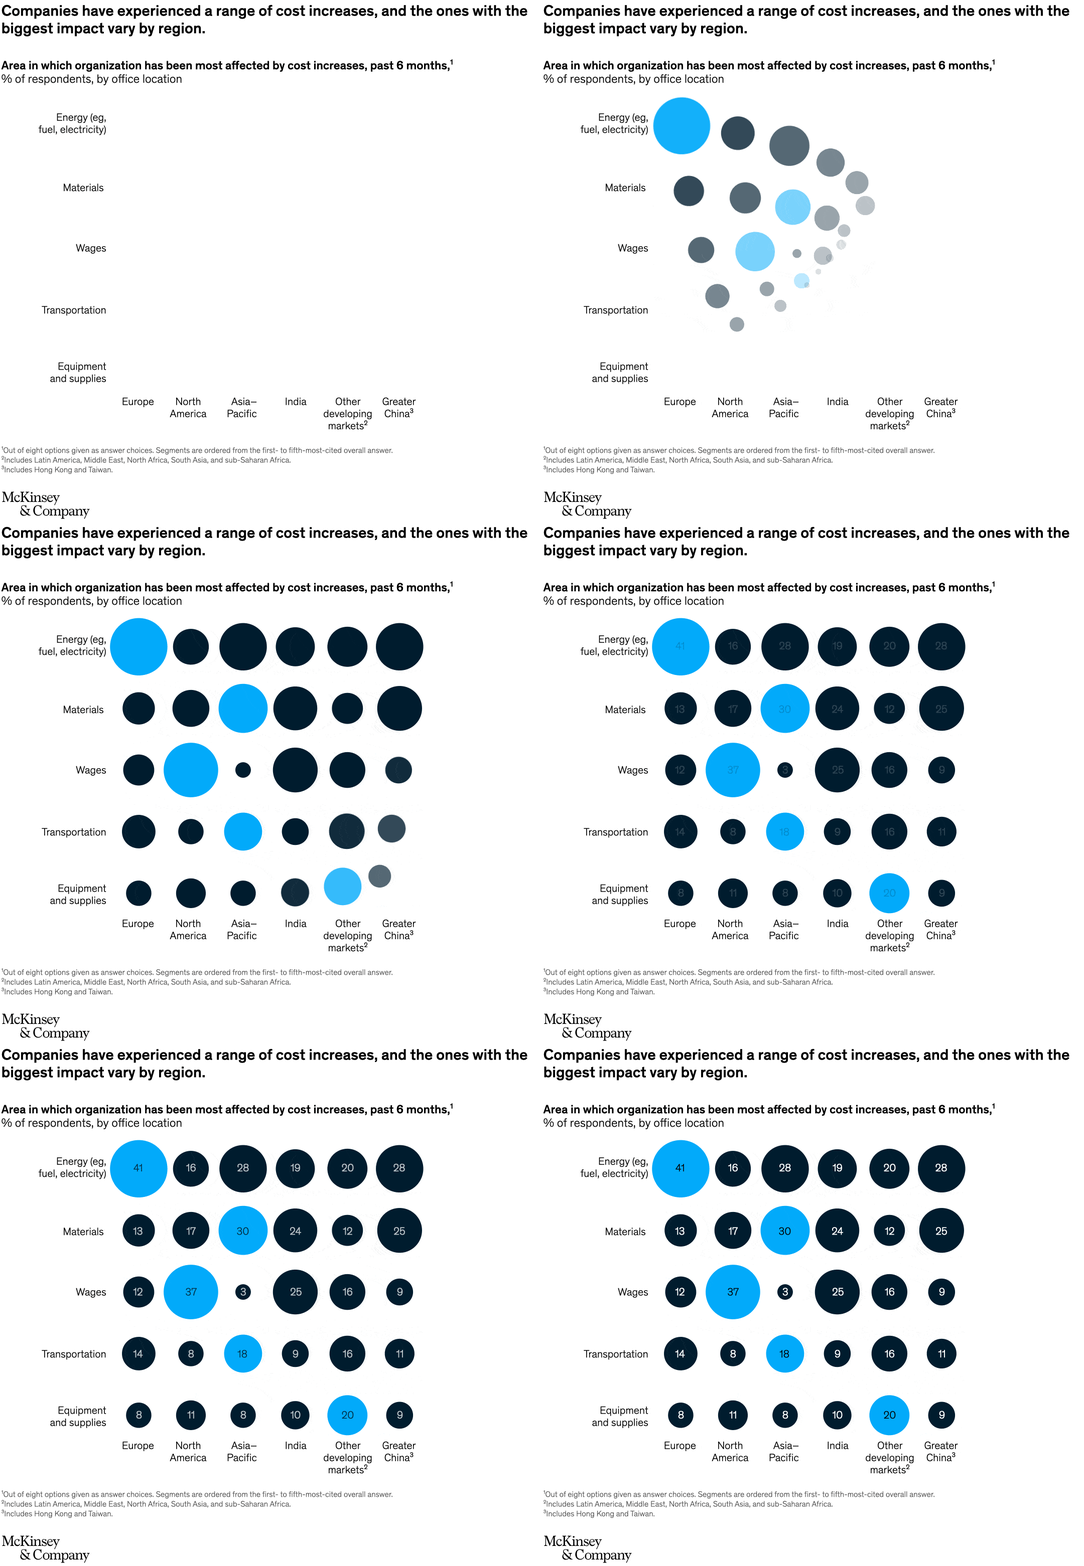
November 22, 2022 – Cost increases are looming large in the minds of organizational leaders, according to results of McKinsey’s latest economic conditions outlook survey. Senior partner Sven Smit and colleagues note that nine out of ten survey respondents report experiencing rising costs in the previous six months. Respondents in Europe point to energy prices as having the biggest effect on their companies, while rising wages top the concerns of those in India and North America.
To read the survey, see “Economic conditions outlook,” September 29, 2022.
customizer here
Visual form
Regional survey comparison chart.
Layout / body structure
The chart is laid out as a region-by-region comparison of cost pressure, so the reader scans the categories of rising cost and then compares which ones matter most in Europe versus other regions. The reading order is categorical first and regional second.
What is being compared
It compares the kinds of cost increases companies are facing and how the most damaging cost categories differ across regions.
Measurement system
The page is built from survey shares, with the reader tracking the share of respondents reporting different cost increases and the share naming specific costs as having the biggest impact.
Visible structure inside the graphic
The internal pieces are the cost categories and the regional response bars or segments attached to each one. The structure is comparative and grouped, making regional divergence part of the visual story.
Main takeaway from the visual
The chart shows that rising costs are widespread, but the composition of that pressure is not the same everywhere. Europe visually stands out for the weight of energy prices, while other regions emphasize different cost buckets.
Key standout values or extremes
The strongest headline number is that nine out of ten survey respondents reported rising costs in the previous six months. The largest regional contrast is that European respondents identify energy prices as the cost category with the biggest effect.
Controls / sequence, when applicable
This is a static chart image with no in-chart controls to operate.
Companion media, when applicable
There is no separate companion audio or video; the chart image is the full visual on this page.