Source page: McKinsey & Company
Commentary
Fortune favors the bold
Strategy | Economy | Resilience
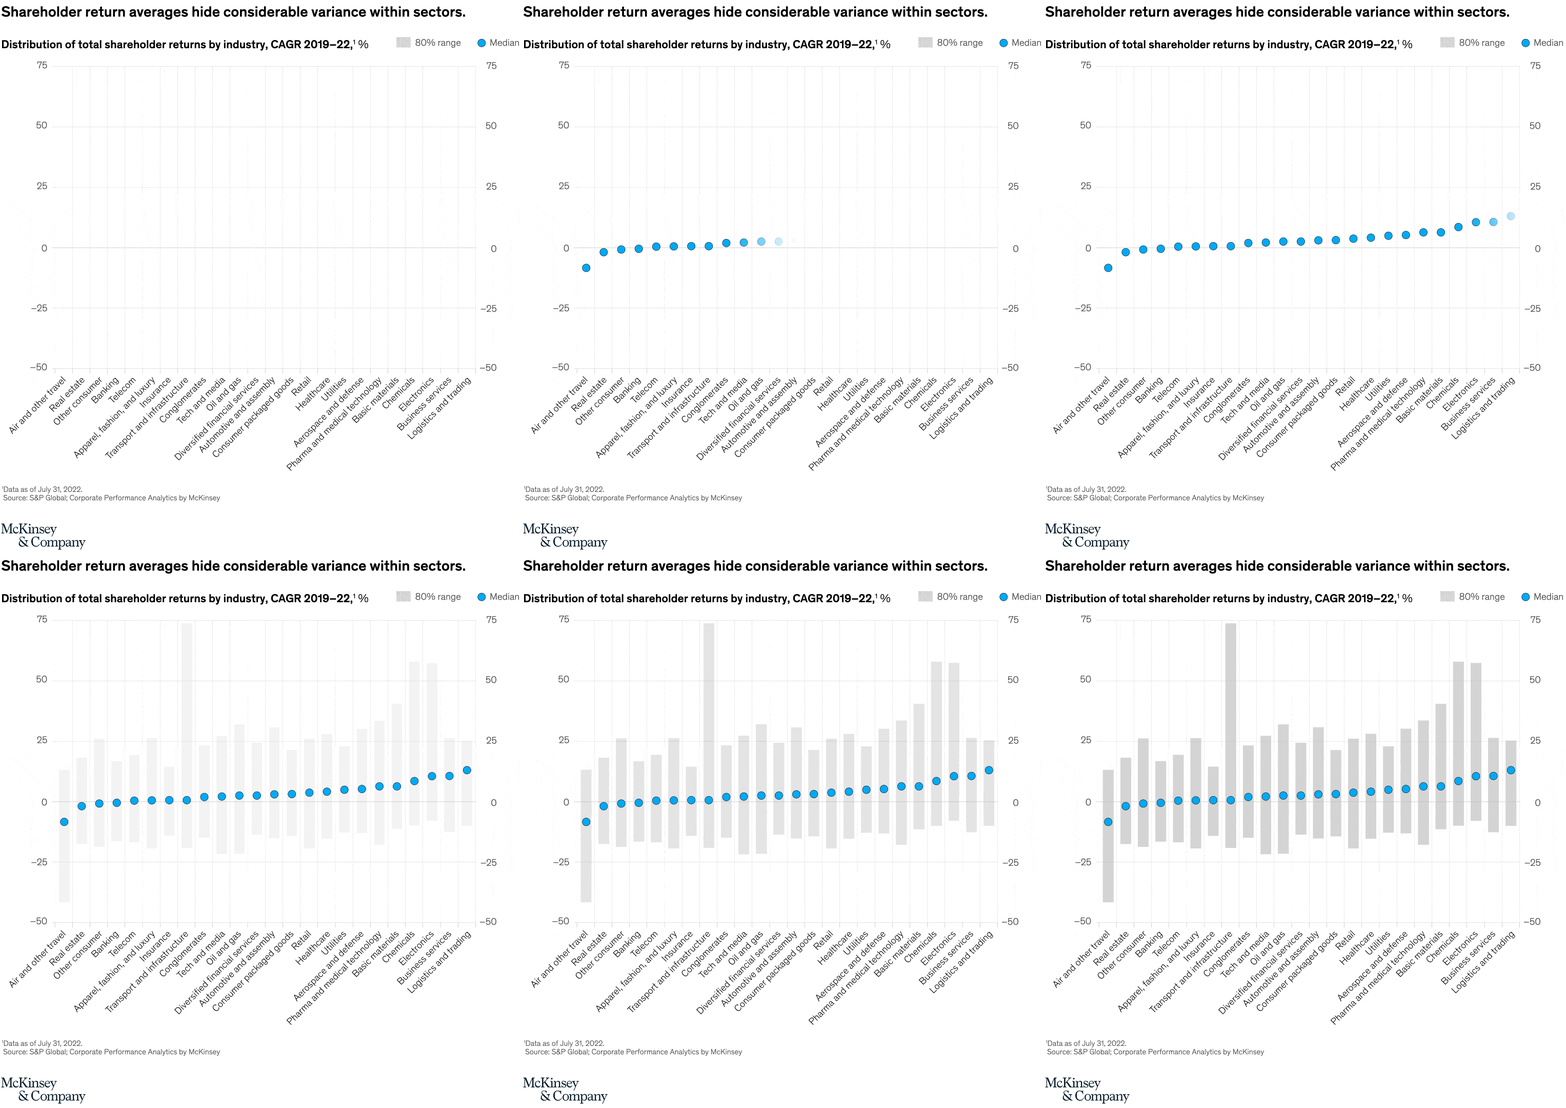
October 26, 2022 – The sheer number of ongoing global shocks—inflation, a pandemic, the invasion of Ukraine—has many organizations hunkering down and awaiting an end to the present volatility. Others, though, see a chance to act quickly and decisively, before others have committed to making moves. McKinsey global managing partner Bob Sternfels and coauthors share how the variance between leaders and also-rans is reflected in recent averages in shareholder returns.
To read the article, see “Strategic courage in an age of volatility,” August 29, 2022.
customizer here
Visual form
Variance distribution chart.
Layout / body structure
The chart is organized around sector-level variance rather than simple averages, so the reader first sees the spread within sectors and then reads the implication for leaders versus also-rans. The layout emphasizes dispersion, not just center points.
What is being compared
It compares shareholder returns within sectors, showing how much separation exists between the strongest performers and the rest of the field during volatile periods.
Measurement system
The page uses shareholder return as the core measure, with the important visual signal coming from dispersion and spread rather than a single average value.
Visible structure inside the graphic
The main internal pieces are sector groupings and the return distributions inside them. The structure highlights how much room there is between the upper end and the average, making variance itself part of the message.
Main takeaway from the visual
The chart shows that volatility creates bigger room for decisive winners to separate from the pack. Sector averages hide how wide that gap can become, which is why the page argues for strategic boldness rather than passivity.
Key standout values or extremes
The strongest visual cue is not one headline number but the amount of spread hidden behind shareholder-return averages. The page explicitly states that those averages conceal considerable variance within sectors.
Controls / sequence, when applicable
This is a static chart image with no in-chart controls to operate.
Companion media, when applicable
There is no separate companion audio or video; the chart image is the full visual on this page.