Source page: McKinsey & Company
Commentary
A different kind of credit-card decline
Consumer | Financial services
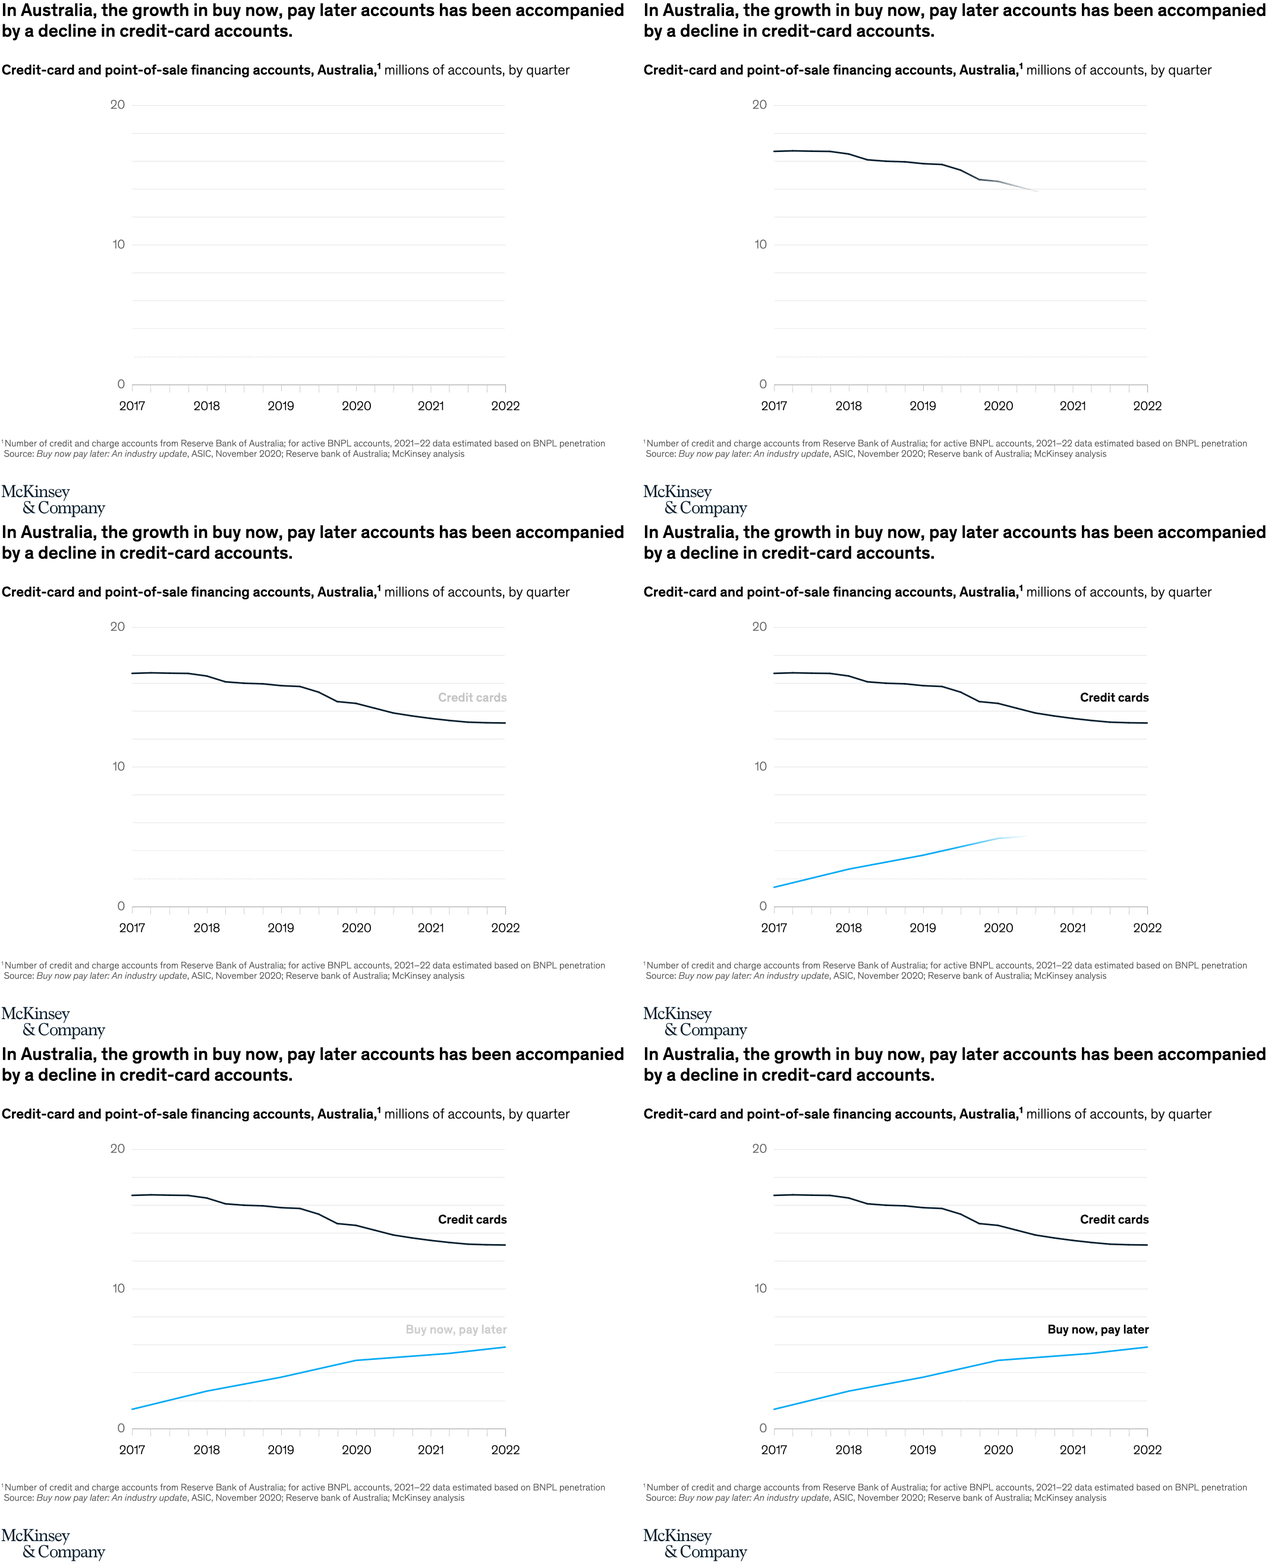
October 6, 2022 – In Australia, credit-card accounts have declined by about 6 percent a year, while buy now, pay later (BNPL) accounts have grown by more than 40 percent a year since 2017. Because of its higher interchange fees and different market fundamentals, the United States may see a more muted shift than in Australia, but it appears that replacement is under way in the States.
To read the article, see “Reinventing credit cards: Responses to new lending models in the US,” June 23, 2022.
customizer here
Visual form
Line chart.
Layout / body structure
The visual is presented as a single time-series comparison in the chart slot, read left to right across the period since 2017 and then down to the note beneath it.
What is being compared
It compares the trajectory of traditional credit-card accounts against buy now, pay later accounts, using Australia as the visible case and the United States as supporting context in the text.
Measurement system
The chart is expressed through growth and decline rates over time, so the reader is following percentage changes and relative account momentum rather than absolute dollar values.
Visible structure inside the graphic
The graphic is organized around two contrasted series, with one line moving downward for credit cards and the other rising sharply for BNPL, making the replacement pattern visible at a glance.
Main takeaway from the visual
The chart shows the two payment forms moving in opposite directions, with BNPL climbing while credit-card accounts contract, which makes the substitution story feel visible rather than theoretical.
Key standout values or extremes
The clearest anchored values on the page are the annualized shifts since 2017: credit-card accounts down about 6 percent a year and BNPL accounts up by more than 40 percent a year in Australia.
Controls / sequence, when applicable
This is a static chart image with no in-chart controls to operate.
Companion media, when applicable
There is no separate companion audio or video; the chart image is the full visual on this page.