Source page: McKinsey & Company
Commentary
Rough seas for freights
Logistics | Supply Chain Management | Shipping
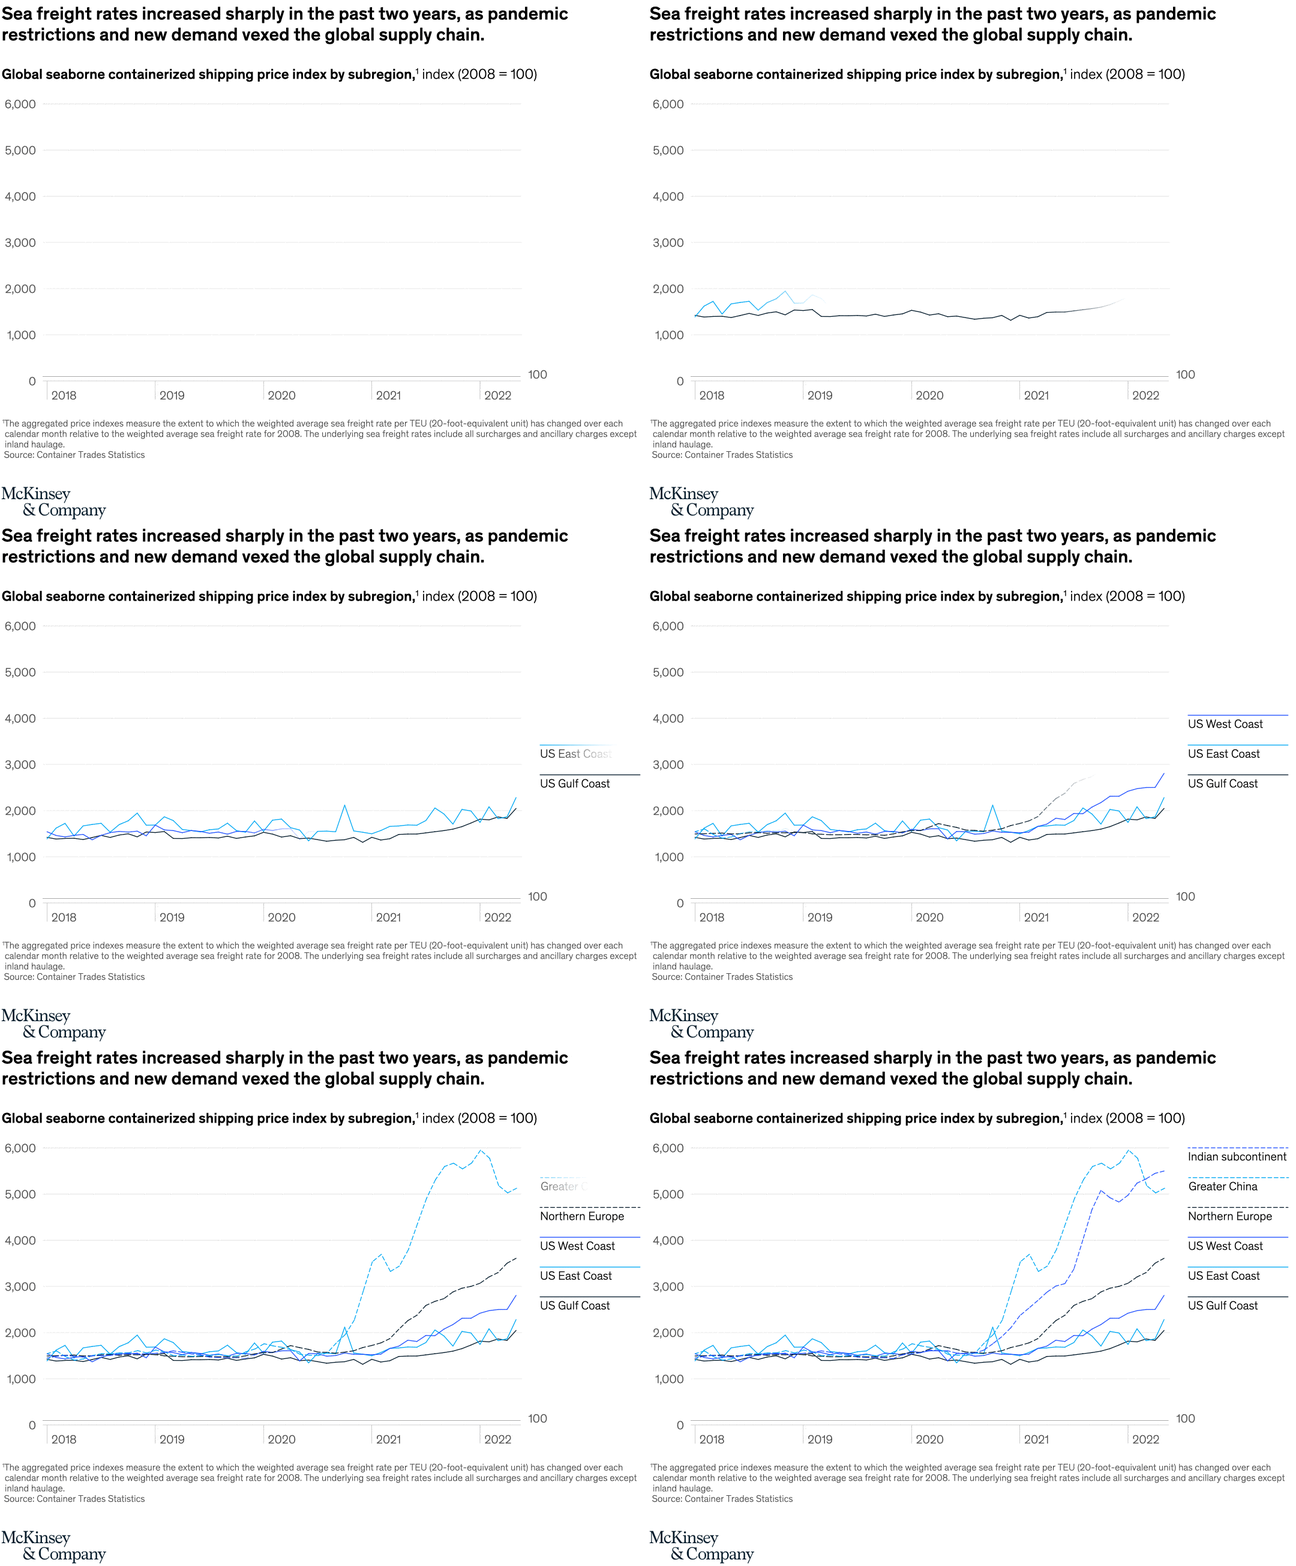
September 21, 2022 – Sea freight rates are keeping the global supply chain under pressure. Since the start of the COVID-19 pandemic, rates have increased sharply—particularly in the Indian subcontinent and Greater China. Furthermore, sea freight rates are more than 20 times higher than they were at the beginning of 2008’s Great Recession.
To read the article, see “Global Economics Intelligence executive summary, August 2022,” September 9, 2022.
customizer here
Visual form
Line chart.
Layout / body structure
The chart fills the main visual slot as a single time-series comparison, read left to right across the freight-rate history and then down to the short supporting note.
What is being compared
The chart compares sea-freight rate movements over time, with particular attention to the post-pandemic surge and the especially sharp increases linked to the Indian subcontinent and Greater China.
Measurement system
The reader is tracking freight-rate levels and relative multiples over time, so the key unit is the rate index or equivalent rate scale rather than a share of respondents or a revenue bar.
Visible structure inside the graphic
The visual is organized as one or more lines tracking freight-rate paths across time, making the recent spike and the divergence from earlier baselines immediately visible.
Main takeaway from the visual
The chart shows freight costs moving from ordinary volatility into an extreme surge, which visually underlines why shipping has stayed a pressure point in the supply chain.
Key standout values or extremes
The strongest value anchored on the page is the scale of the surge itself: sea-freight rates rose to more than 20 times the level seen at the beginning of the 2008 Great Recession.
Controls / sequence, when applicable
This is a static chart image with no in-chart controls to operate.
Companion media, when applicable
There is no separate companion audio or video; the chart image is the full visual on this page.