Source page: McKinsey & Company
Commentary
Betting big on quantum
Technology | China
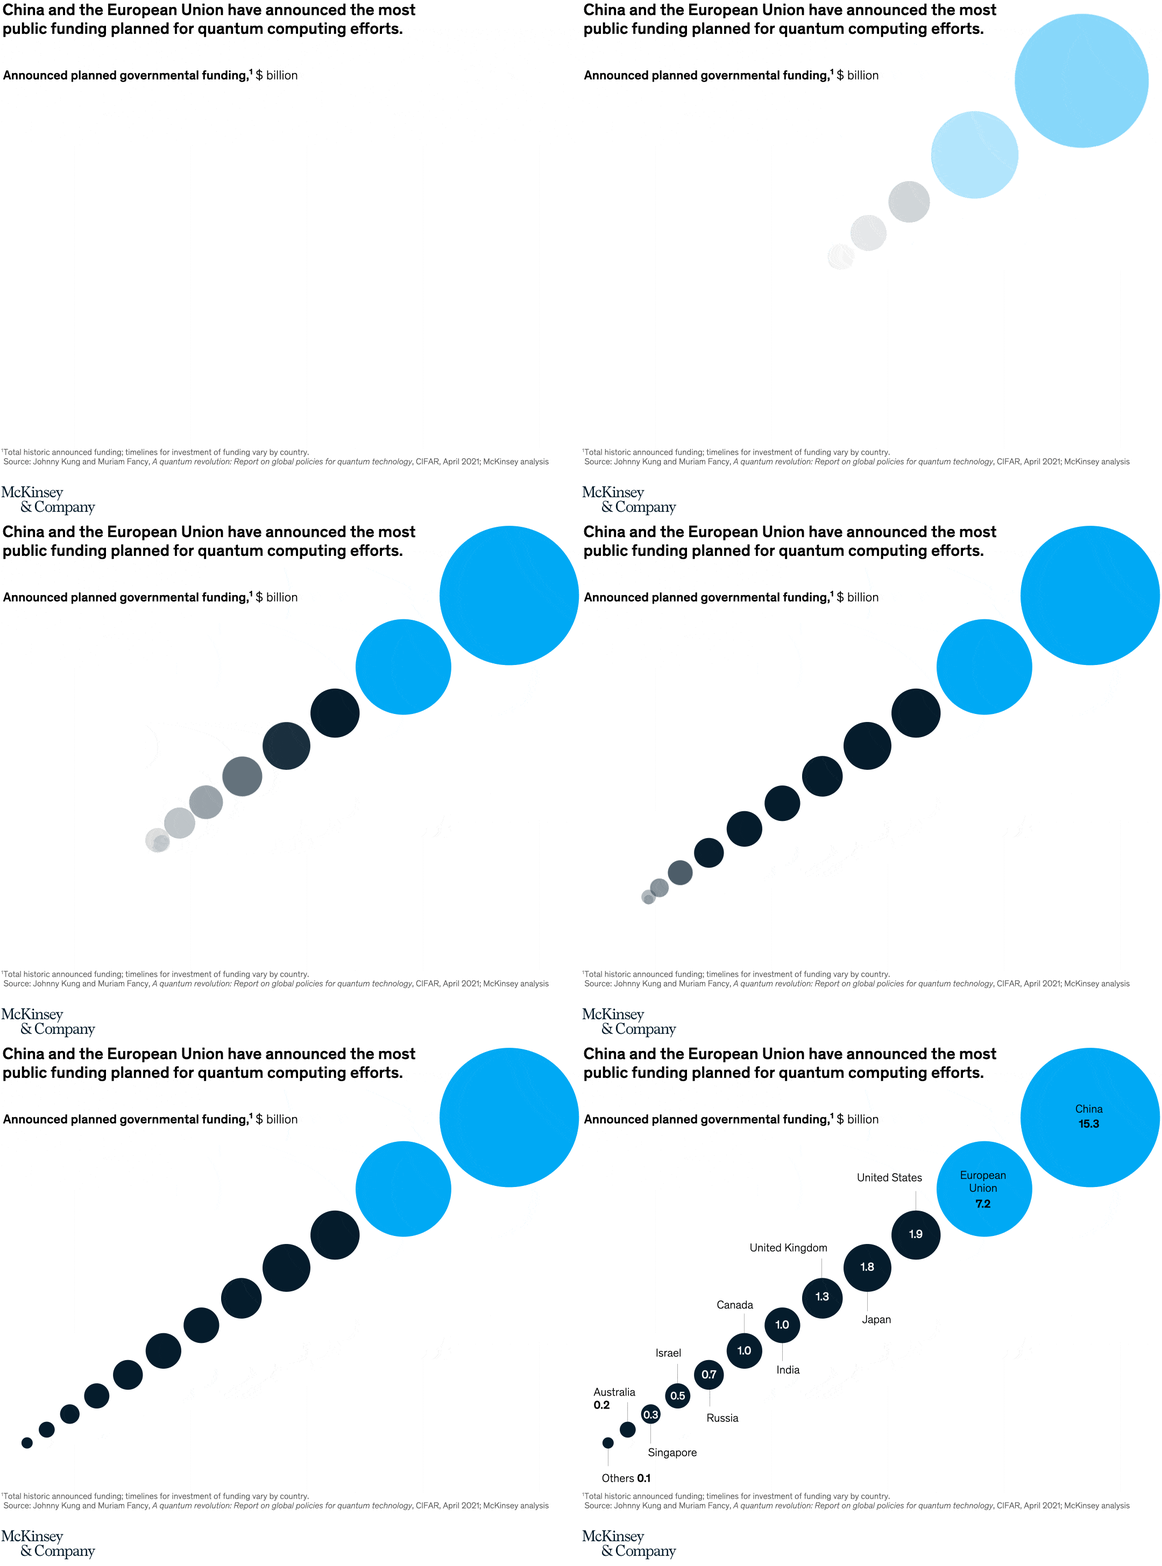
September 13, 2022 – Quantum technologies could be the key to resolving global issues from climate change to improving drug-delivery times. China has committed $15.3 billion in public funds in quantum computing investments, which is more than double that of EU governments ($7.2 billion) and eight times what the United States has pledged to spend ($1.9 billion).
To read the article, see “Quantum computing funding remains strong, but talent gap raises concern,” June 15, 2022.
customizer here
Visual form
Bubble chart.
Layout / body structure
A single bubble chart fills the visual area. The eye reads it from the smallest bubbles at the lower left up along the diagonal to the largest circles at the upper right, with country labels placed beside the bubbles and connected by thin leader lines.
What is being compared
The chart compares countries and regional blocs by announced planned governmental funding for quantum computing efforts.
Measurement system
The measure is funding in billions of dollars. The source note says the values are total historic announced funding, and the bubble sizes encode the magnitude of those amounts.
Visible structure inside the graphic
Each country or bloc is shown as its own circle, sized by funding. The bubbles step upward from Others, Australia, and Singapore through Israel, Russia, Canada, India, the United Kingdom, Japan, and the United States, and then jump sharply to the European Union and China.
Main takeaway from the visual
The visual makes the funding concentration obvious: China and the European Union sit far above the rest of the field, while every other country shown occupies a much smaller bubble below the two leaders.
Key standout values or extremes
China is largest at 15.3 billion dollars, followed by the European Union at 7.2. The next tier is much smaller: the United States at 1.9, Japan at 1.8, and the United Kingdom at 1.3. Canada and India are both at 1.0, Russia is at 0.7, Israel is at 0.5, Singapore is at 0.3, Australia is at 0.2, and Others is at 0.1.
Controls / sequence, when applicable
This is a static chart image with no in-chart controls to operate.
Companion media, when applicable
There is no separate companion audio or video; the chart image is the full visual on this page.