Source page: McKinsey & Company
Commentary
Fuels of the future?
Oil & Gas | Sustainability | Decarbonization
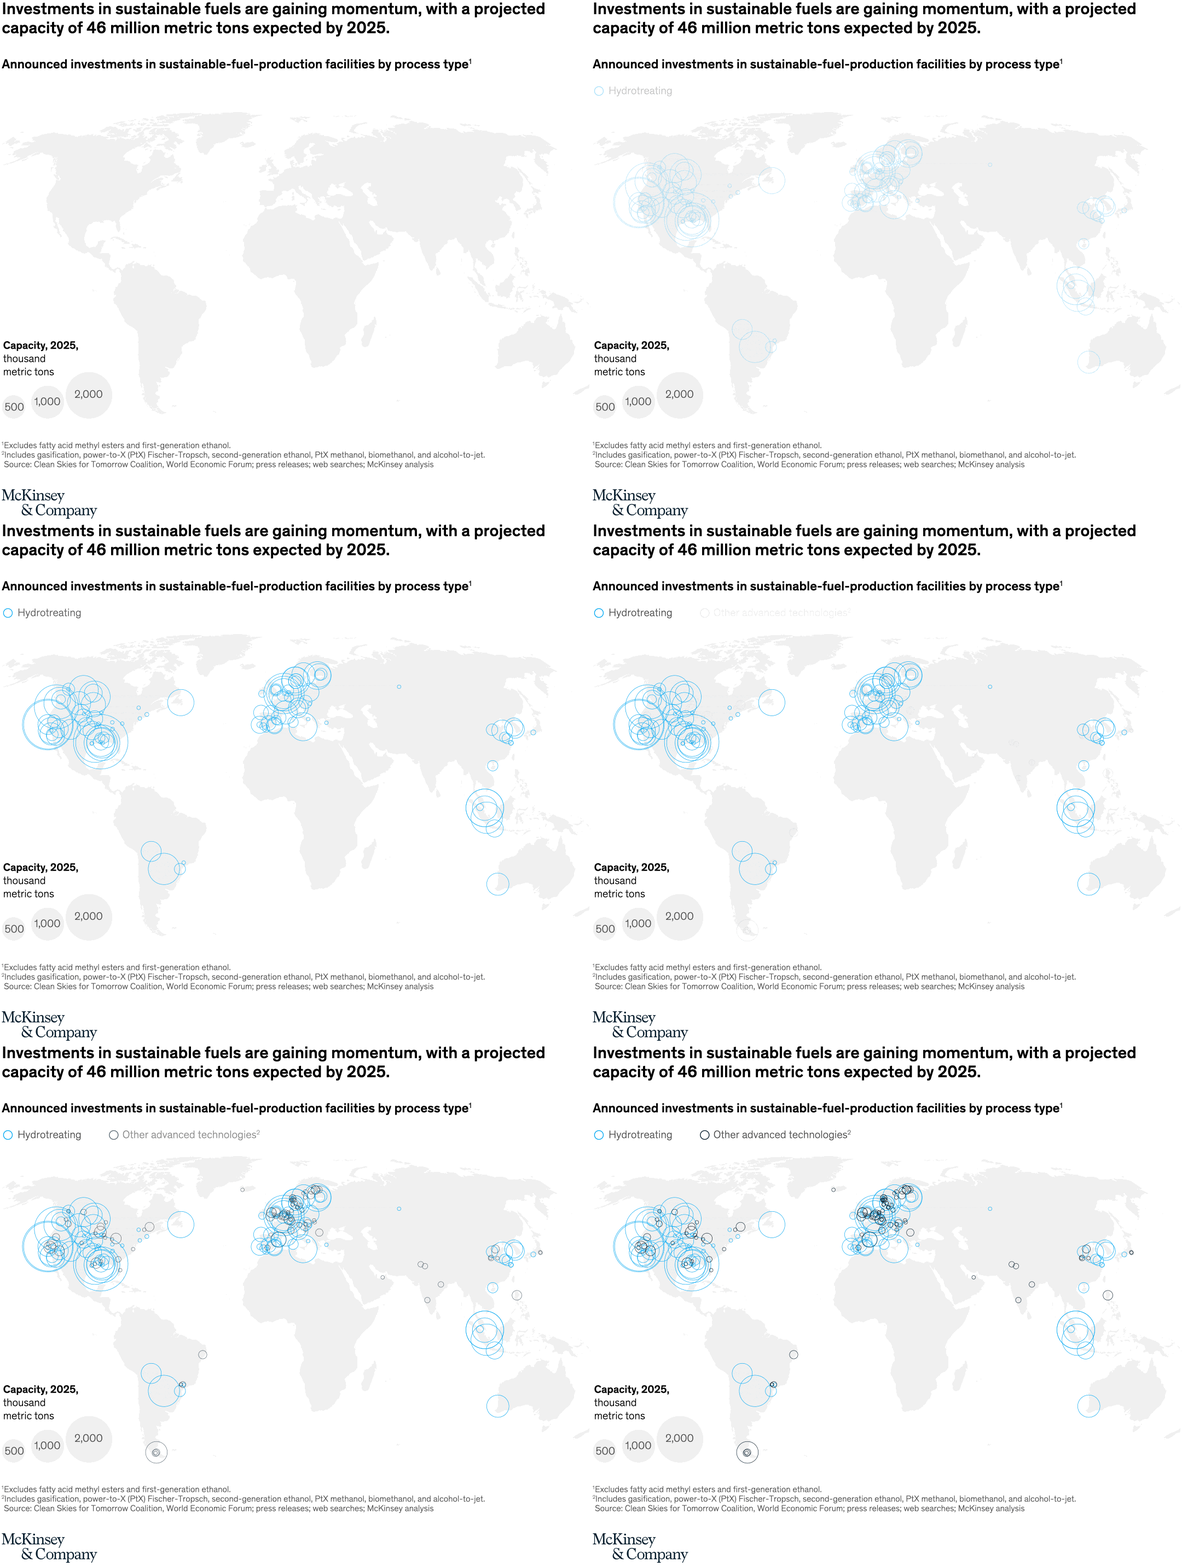
September 2, 2022 – Investments in sustainable fuels—which include biofuels such as hydrotreated vegetable oil and synthetic fuels such as ammonia or methanol—are gaining momentum. A pipeline of $40 billion to $50 billion of total investment in sustainable fuels is planned, with 46 million metric tons of capacity projected by 2025.
To read the article, see “Charting the global energy landscape to 2050: Sustainable fuels,” July 7, 2022.
customizer here
Visual form
Bubble map.
Layout / body structure
A single world map fills the visual area. Bubbles are placed geographically over the map, and the legend at the lower left explains the capacity scale from 500 to 2,000 thousand metric tons while the legend at the top separates hydroreating from other advanced technologies.
What is being compared
The chart compares announced investments in sustainable-fuel-production facilities by process type and by location around the world.
Measurement system
Bubble size represents projected 2025 capacity in thousand metric tons. Circle outline color distinguishes hydrotreating from other advanced technologies, and the page headline anchors the total projected capacity at 46 million metric tons by 2025.
Visible structure inside the graphic
The map shows dense clusters of bubbles in North America and Europe, another visible group across East Asia, and smaller but still noticeable concentrations in South America and Australia. The largest circles sit over North America and Europe, and the map uses a simple two-type legend plus the bubble-size legend to organize the view.
Main takeaway from the visual
The visual shows sustainable-fuel investment broadening globally but concentrating most heavily in North America and Europe, where the biggest planned capacities are clustered.
Key standout values or extremes
The strongest anchored figure on the page is the projected total capacity of 46 million metric tons by 2025. The bubble legend marks major capacity steps at 500, 1,000, and 2,000 thousand metric tons, and the largest plotted circles appear in North America and Europe.
Controls / sequence, when applicable
This is a static chart image with no in-chart controls to operate.
Companion media, when applicable
There is no separate companion audio or video; the chart image is the full visual on this page.