Source page: McKinsey & Company
Commentary
Machine learning meets higher learning
Education | Technology
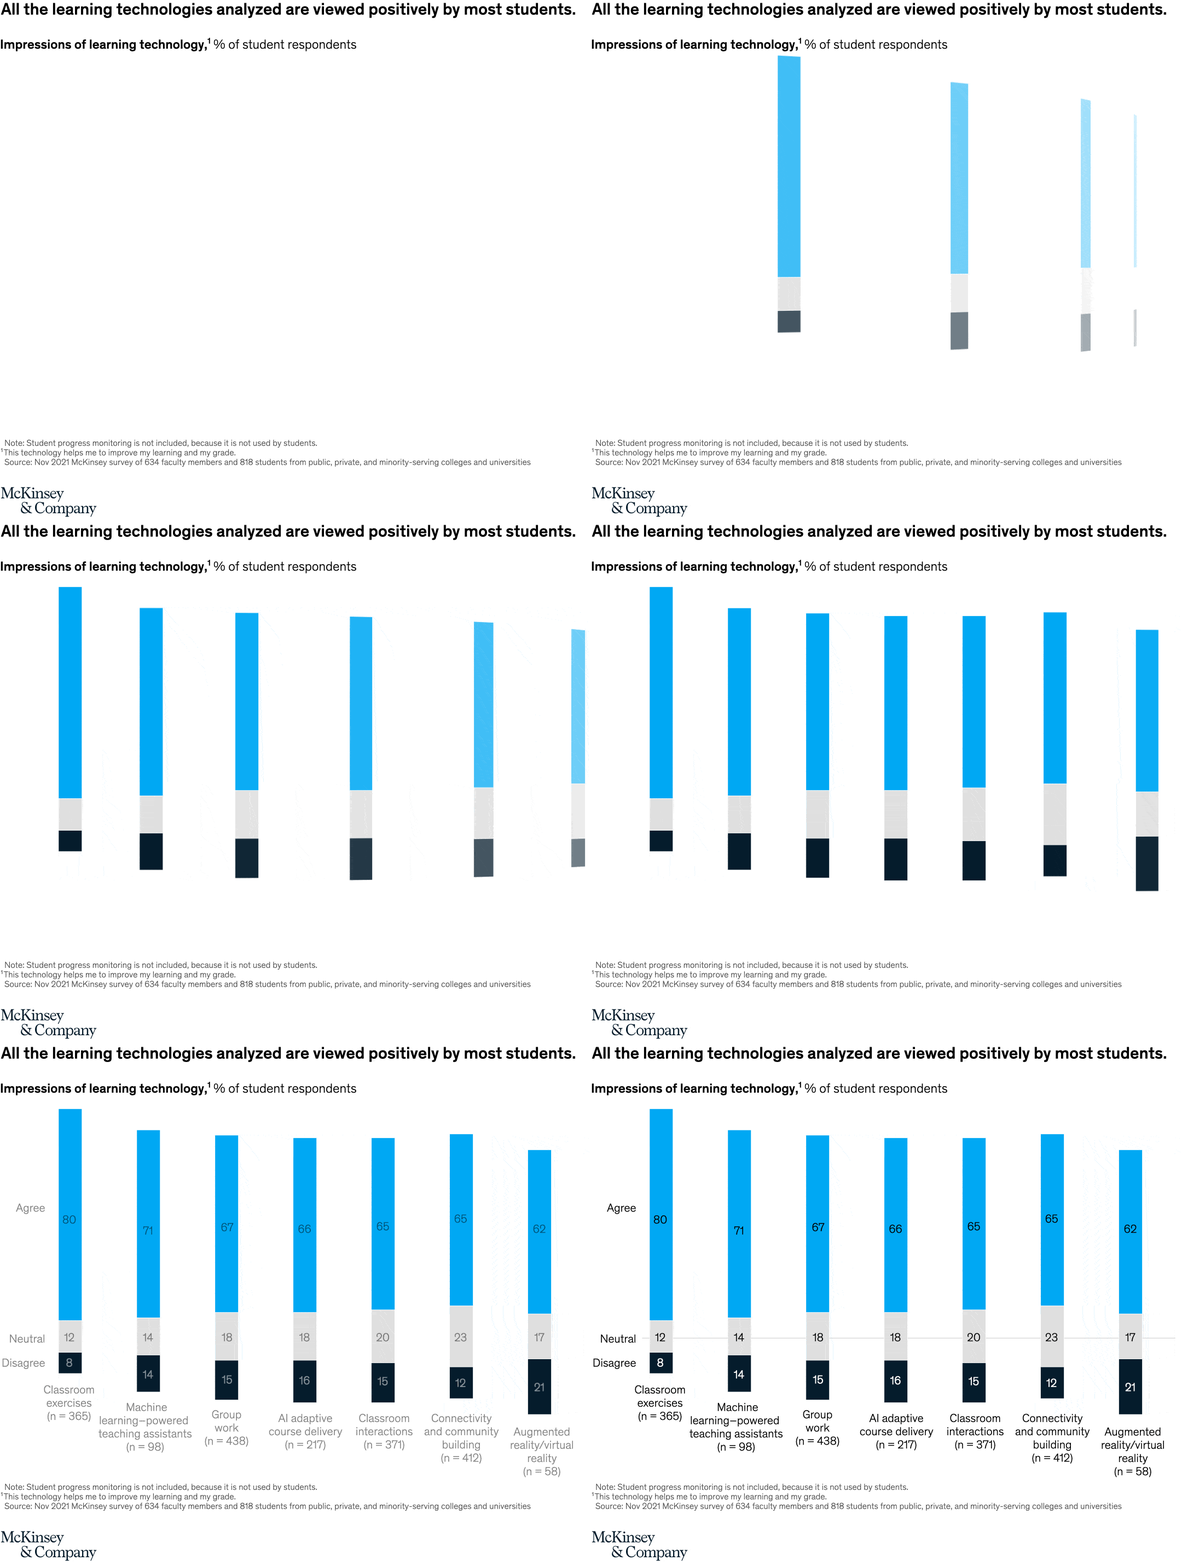
August 19, 2022 – Students in higher education are eager to continue using new classroom learning technologies adopted during the pandemic, according to McKinsey research. In a survey, more than 60 percent of students said that all the classroom learning technologies they’ve used since COVID-19 began had improved their learning and grades. Two technologies in particular stood out for boosting academic performance: 80 percent of students cited classroom exercises, and 71 percent cited machine learning–powered teaching assistants.
To read the article, see “How technology is shaping learning in higher education,” June 15, 2022.
customizer here
Visual form
A diverging stacked column chart with seven technology categories.
Layout / body structure
The chart is one wide comparison chart read left to right across seven learning technologies. Each column is split into agree above the baseline, neutral on the baseline, and disagree below it, with the percentage labels printed inside the segments and the technology names stacked under the bars.
What is being compared
The chart compares student impressions of seven learning technologies: classroom exercises, machine-learning-powered teaching assistants, group work, AI adaptive course delivery, classroom interactions, connectivity and community building, and augmented reality or virtual reality.
Measurement system
The measurement is percentage of student respondents. Blue marks the share who agree the technology helps improve learning and grades, gray marks neutral responses, and the dark segment below the midline marks disagreement.
Visible structure inside the graphic
There are seven stacked columns with values printed directly into the bars. Classroom exercises and machine-learning-powered teaching assistants sit on the left with the strongest blue segments, while augmented reality or virtual reality closes the set on the right with the smallest agree segment and the largest visible disagree share.
Main takeaway from the visual
The visual shows that every learning technology in the set is net positive with a majority of students agreeing, but the strength of that positive response varies meaningfully. Traditional classroom exercises lead the ranking, machine-learning-powered teaching assistants come next, and augmented reality or virtual reality has the weakest support and the heaviest resistance.
Key standout values or extremes
The standout values are 80 percent agree for classroom exercises, 71 percent agree for machine-learning-powered teaching assistants, 67 percent for group work, 66 percent for AI adaptive course delivery, 65 percent each for classroom interactions and connectivity and community building, and 62 percent for augmented reality or virtual reality. On the negative side, augmented reality or virtual reality has the highest disagree share at 21 percent, while classroom exercises has the lowest at 8 percent.
Controls / sequence, when applicable
This is a static chart image with no in-chart controls to operate.
Companion media, when applicable
There is no separate companion audio or video; the chart image is the full visual on this page.