Source page: McKinsey & Company
Commentary
Doubling down on innovation
Pharmaceuticals & Medical Products
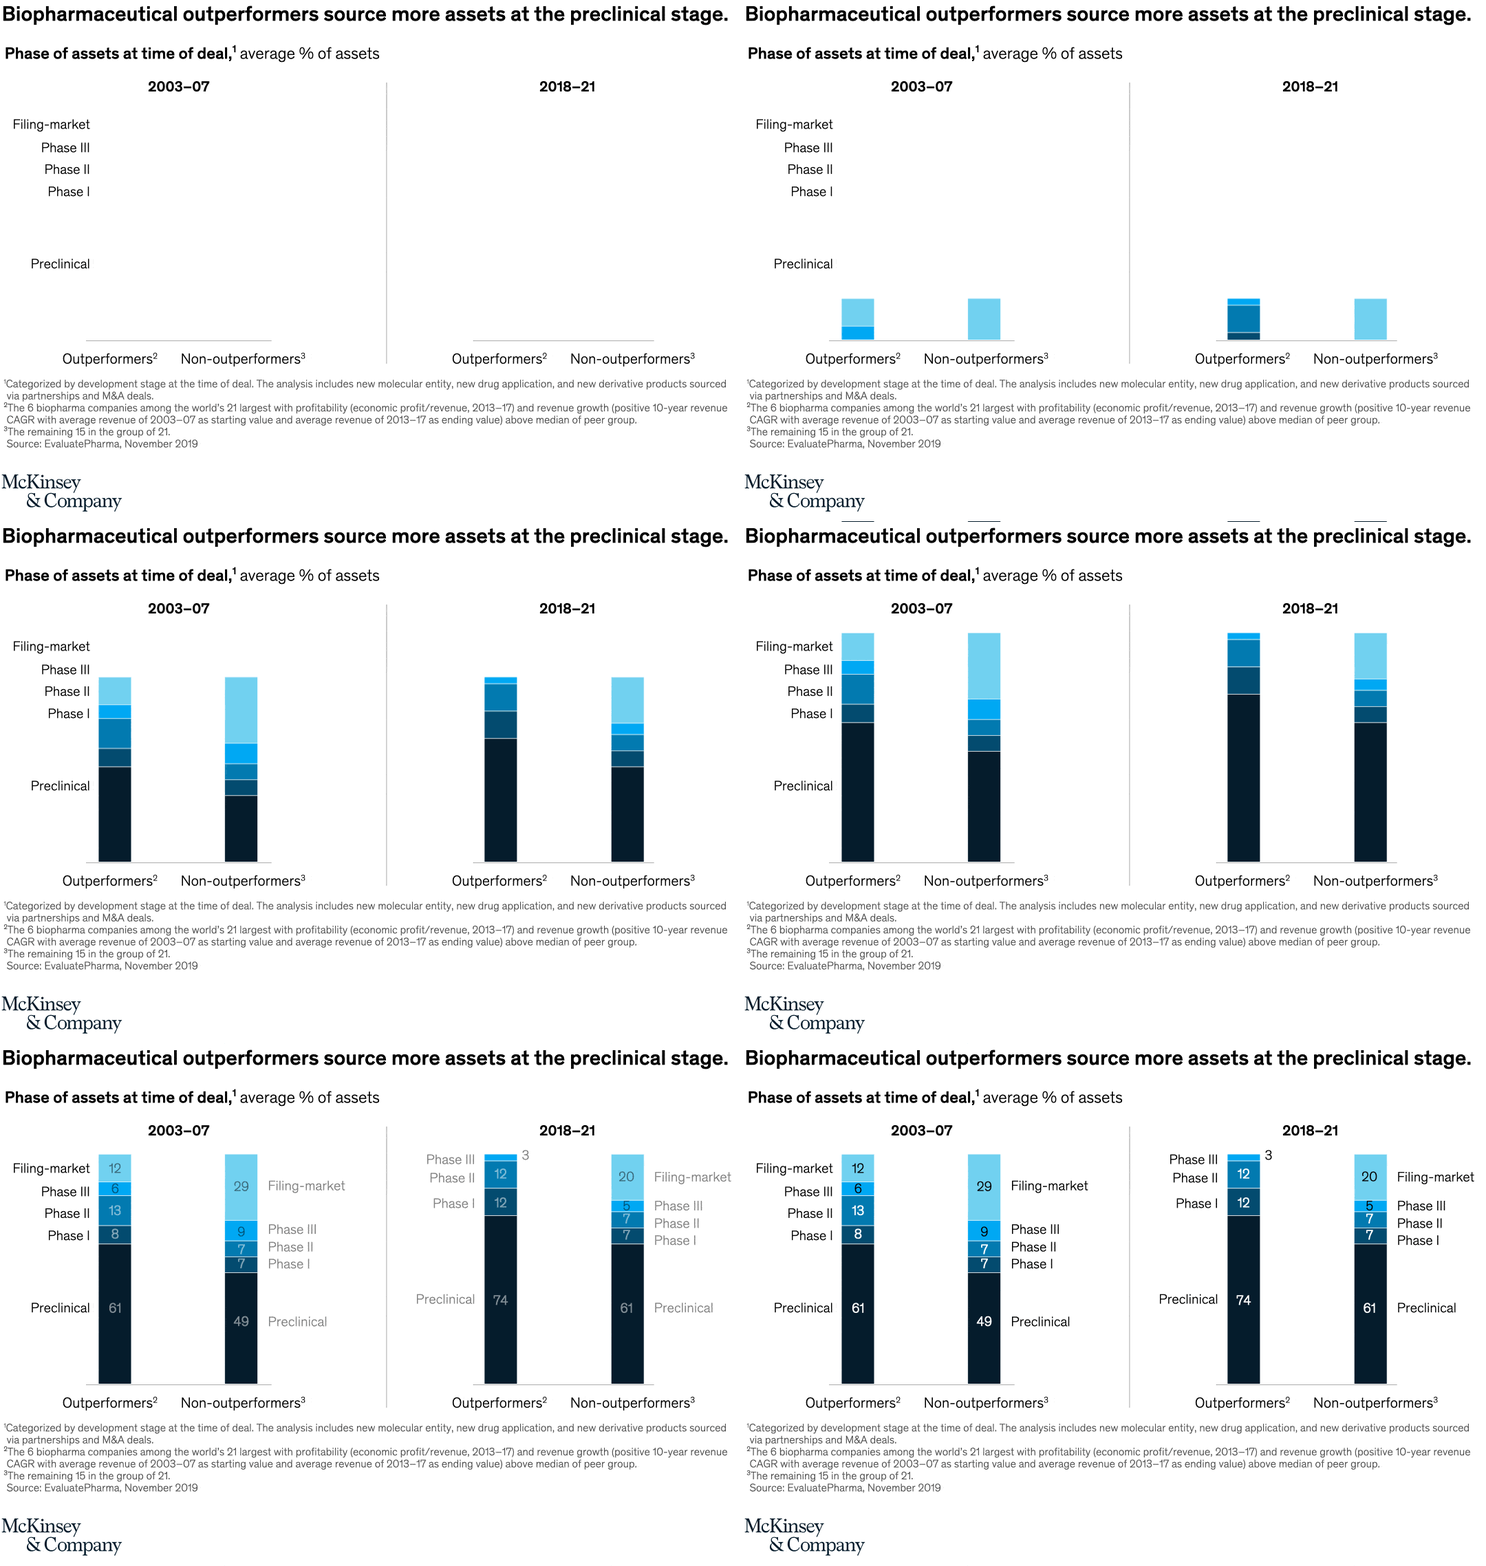
August 15, 2022 – Biopharmaceutical outperformers tend to double down on early innovation. According to our analysis, between 2003 and 2007, outperformers sourced 61 percent of their assets at the preclinical stage—compared with 49 percent for others in the group. That number grew to 74 percent between 2018 and the beginning of December 2021.
To read the article, see “Innovation sourcing in biopharma: Four practices to maximize success,” May 31, 2022.
customizer here
Visual form
Two-period 100 percent stacked column chart.
Layout / body structure
The chart is split into two time windows, 2003-07 on the left and 2018-21 on the right. Inside each window, two stacked columns sit side by side for Outperformers and Non-outperformers, so the reader moves left to right by era and then compares the two company groups within each era.
What is being compared
The chart compares the phase of sourced biopharmaceutical assets at the time of deal for outperformers versus non-outperformers across two different periods. Each stack breaks the asset mix into Preclinical, Phase I, Phase II, Phase III, and Filing-market.
Measurement system
The values are average percentages of assets, so every column totals 100 percent. The dark base segment shows the preclinical share, and the lighter blue segments above it show the later development phases in ascending order toward Filing-market at the top.
Visible structure inside the graphic
Each of the four columns is segmented into five labeled blocks. In 2003-07, the Outperformers column reads 61, 8, 13, 6, and 12 from bottom to top, while the Non-outperformers column reads 49, 7, 7, 9, and 29. In 2018-21, the Outperformers column reads 74, 12, 12, 0, and 3, while the Non-outperformers column reads 61, 7, 7, 5, and 20.
Main takeaway from the visual
The visible gap sits in the dark preclinical base: outperformers devote a larger share of sourced assets to the preclinical stage in both periods, and that lead grows in the later window. At the same time, non-outperformers keep a much larger share in Filing-market, which stays the largest top segment on their side in both eras.
Key standout values or extremes
The clearest anchors are the preclinical shares: 61 percent for outperformers versus 49 percent for non-outperformers in 2003-07, rising to 74 percent versus 61 percent in 2018-21. The largest later-stage difference is Filing-market, where non-outperformers sit at 29 percent in the earlier period and 20 percent in the later one, compared with 12 percent and 3 percent for outperformers.
Controls / sequence, when applicable
This is a static chart image with no in-chart controls to operate.
Companion media, when applicable
There is no separate companion audio or video; the chart image is the full visual on this page.