Source page: McKinsey & Company
Commentary
Virtual worlds, real money
Retail | Digital | Consumer
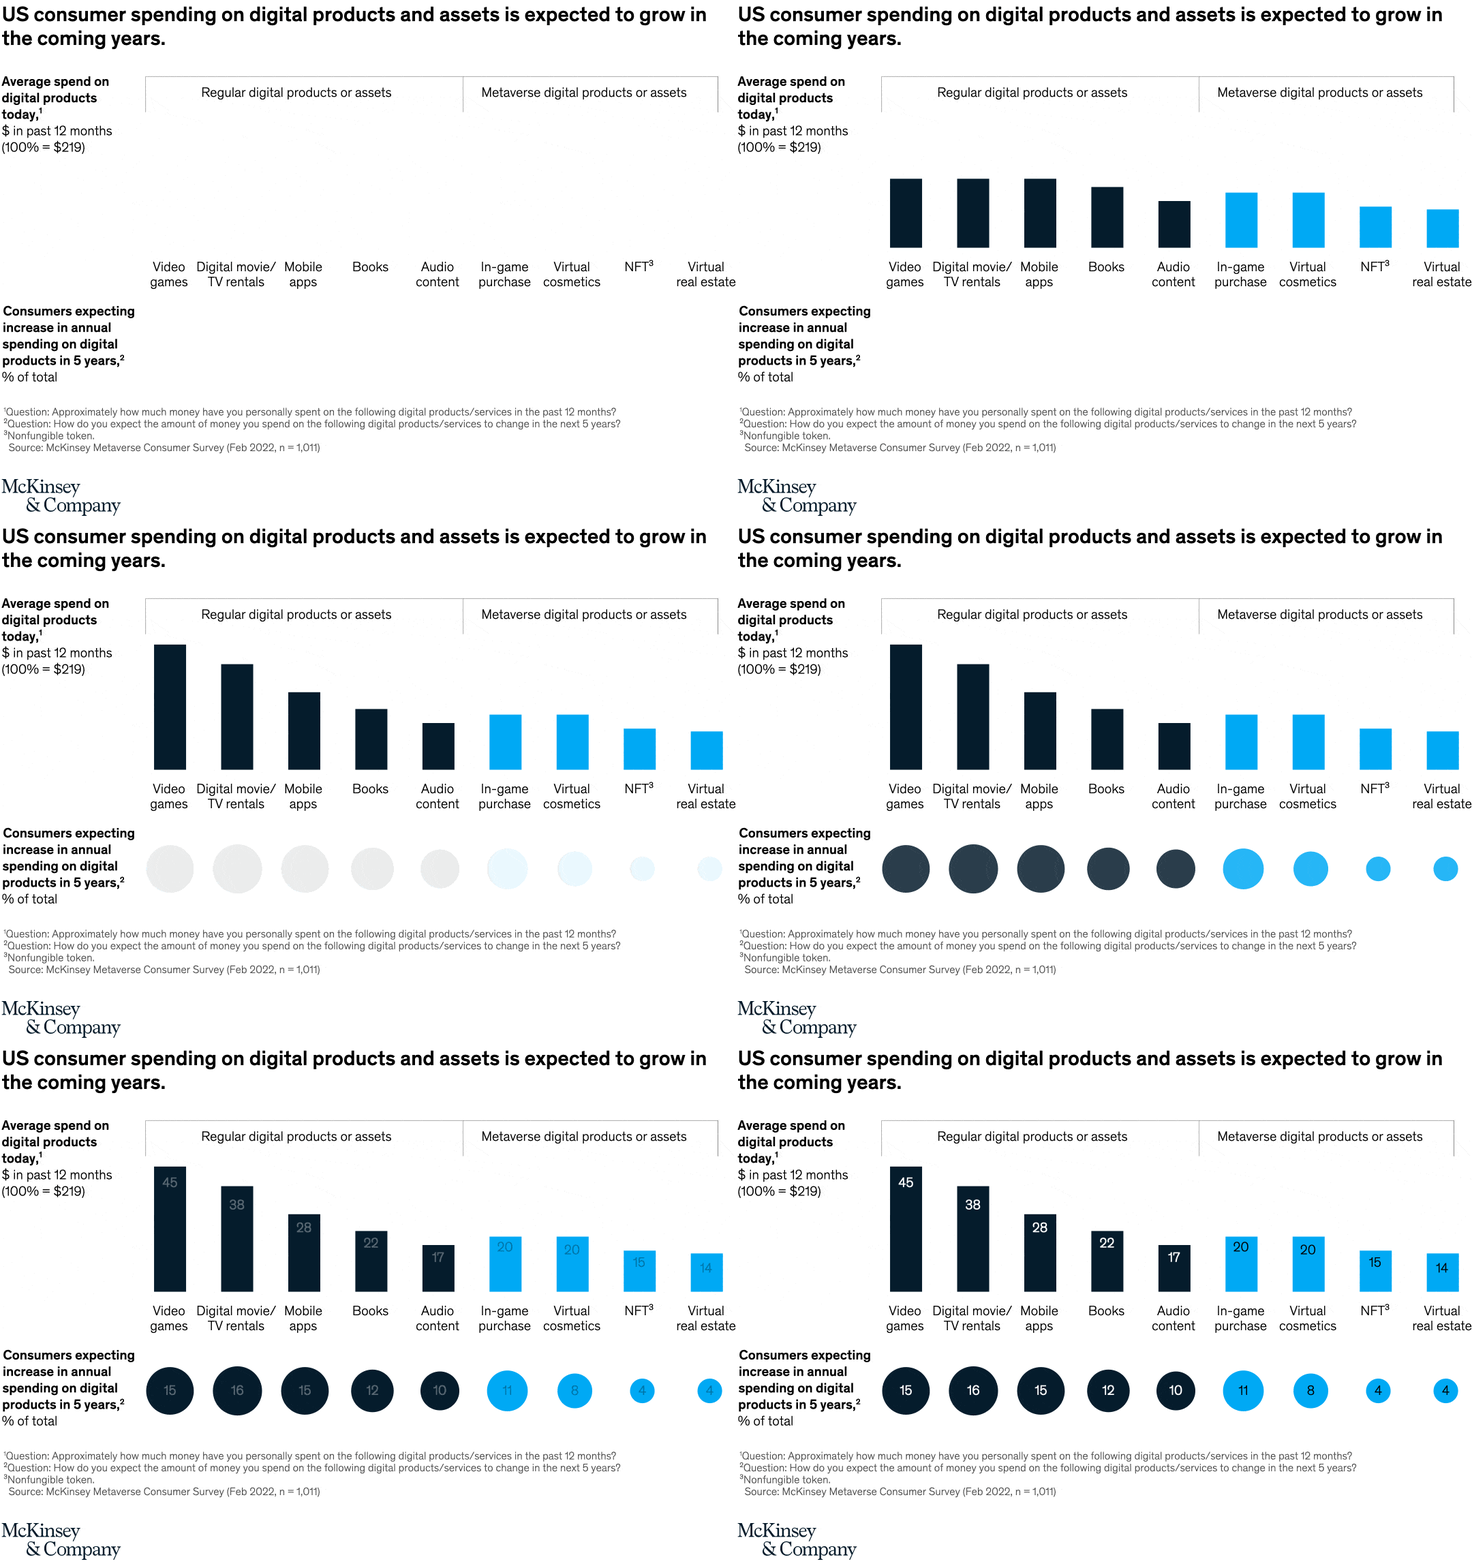
August 9, 2022 – Brands are still sorting out how best to do business in the metaverse. Our recent survey of more than 1,000 consumers shows that there is real money to be made in virtual-reality worlds. Consumers, on average, already spend more than $200 annually on digital assets, with 30 percent of those funds going toward items such as digital media and nonfungible tokens. And the survey respondents indicated they’d spend even more in the metaverse in the future.
To read the article, see “Probing reality and myth in the metaverse,” June 13, 2022.
customizer here
Visual form
Two-row category comparison chart with vertical bars above and proportional circles below.
Layout / body structure
The chart is split into two labeled sections across the same set of columns: Regular digital products or assets on the left and Metaverse digital products or assets on the right. The top row uses bars for average spend today, and the bottom row uses circles for the share of consumers expecting to increase spending over the next five years, so the reader moves top to bottom within each category and then left to right across the full set.
What is being compared
The chart compares eight types of digital spending: Video games, Digital movie and TV rentals, Mobile apps, Books, Audio content, In-game purchase, Virtual cosmetics, NFT, and Virtual real estate. It compares current annual spend in the past 12 months with the share of consumers who expect to increase annual spending in each category over the next five years.
Measurement system
The top row measures dollars spent, anchored by a note that 100 percent equals $219 in the past 12 months. The bottom row measures percent of consumers expecting to increase annual spending, with the numeric values printed inside or on the circles.
Visible structure inside the graphic
The five regular-digital categories use dark bars and dark circles, while the four metaverse categories use bright blue bars and circles. The bar labels read 45, 38, 28, 22, and 17 for the regular group, then 20, 20, 15, and 14 for the metaverse group; the circles underneath read 15, 16, 15, 12, and 10 for the regular group, then 11, 8, 4, and 4 for the metaverse group.
Main takeaway from the visual
The chart shows that consumers already spend real money across both conventional digital products and early metaverse categories, and they still expect that spending to rise. The regular categories are larger today, but metaverse categories like In-game purchase and Virtual cosmetics already sit in the same broad range as Books and Audio content.
Key standout values or extremes
Video games is the largest current-spend category at $45, followed by Digital movie and TV rentals at $38 and Mobile apps at $28. On the metaverse side, In-game purchase and Virtual cosmetics are tied at $20, while NFT and Virtual real estate are lower at $15 and $14. The strongest expected-spend-growth share is Digital movie and TV rentals at 16 percent, while NFT and Virtual real estate are the smallest at 4 percent each.
Controls / sequence, when applicable
This is a static chart image with no in-chart controls to operate.
Companion media, when applicable
There is no separate companion audio or video; the chart image is the full visual on this page.