Source page: McKinsey & Company
Commentary
Trade winds
China | UK | Global Trade
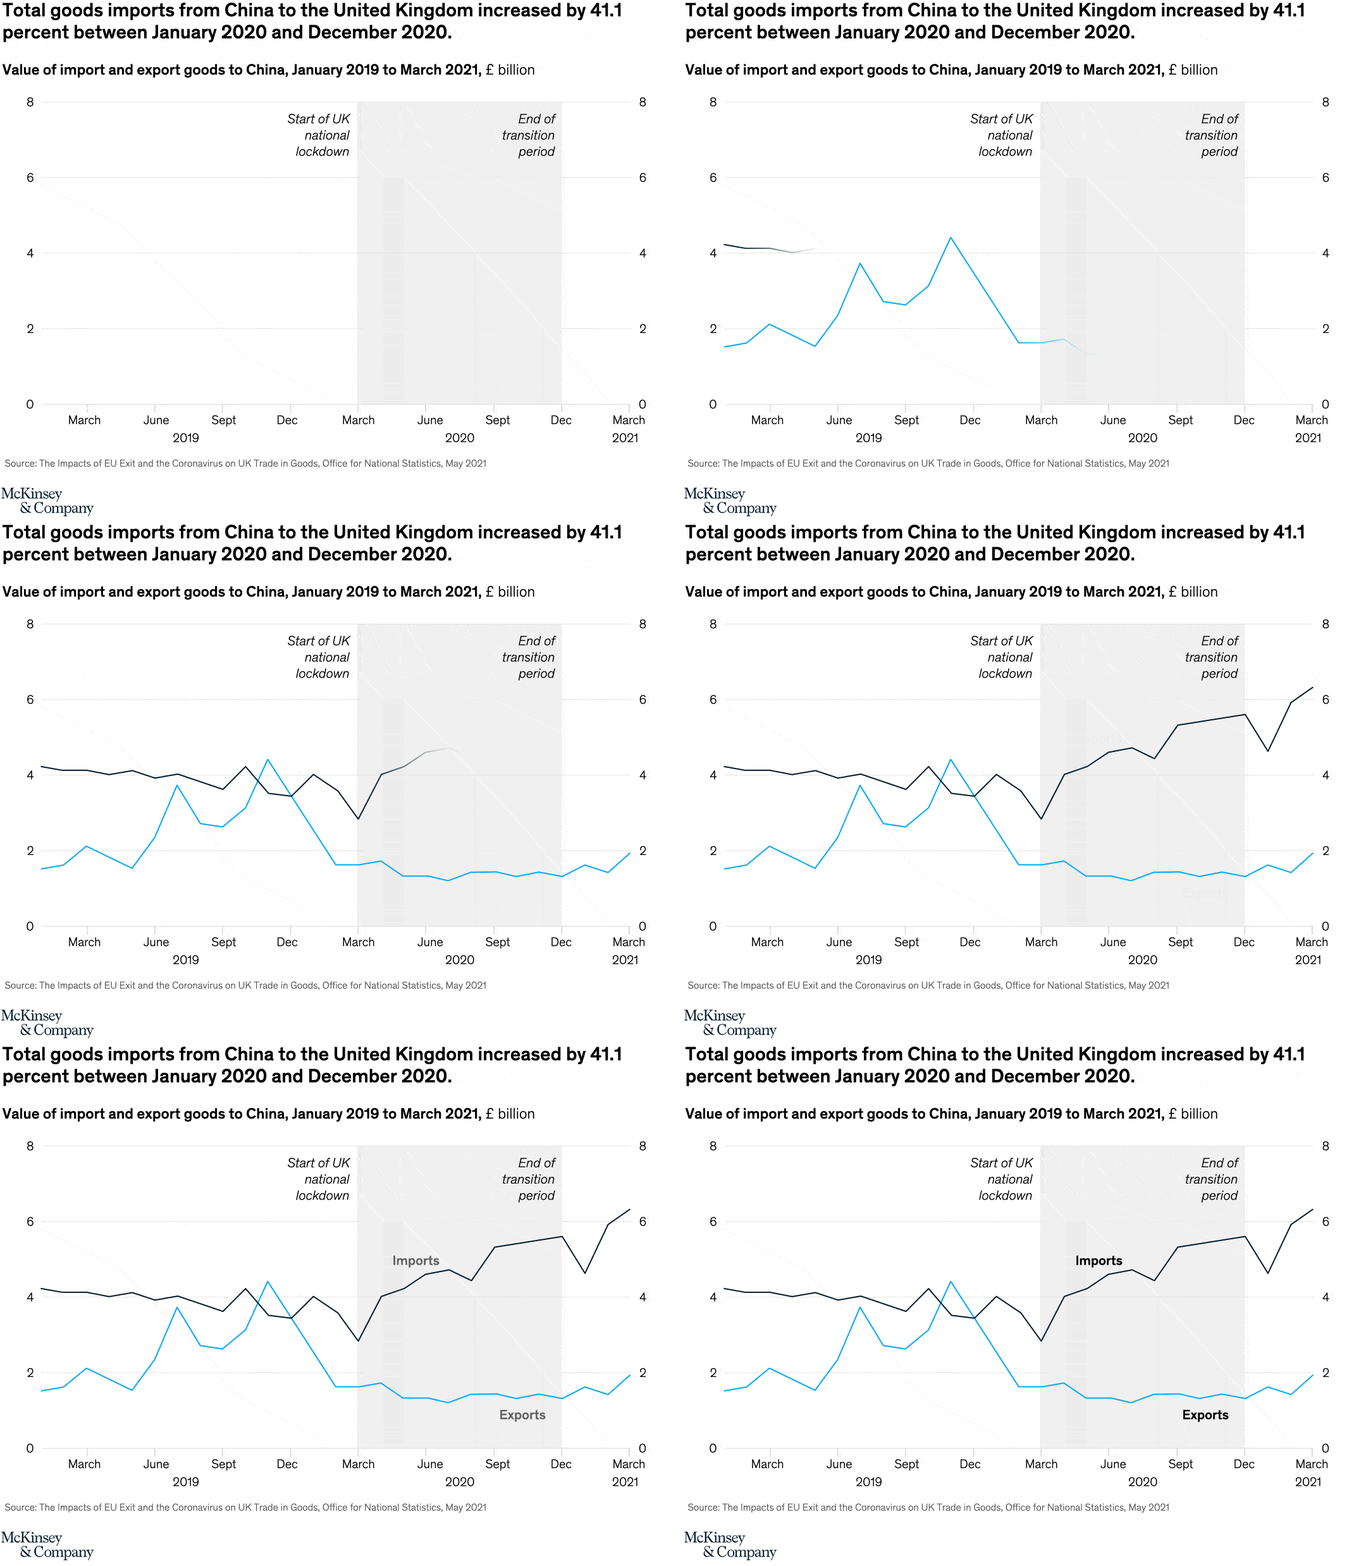
July 28, 2022 – From the second quarter of 2020 through the first quarter of 2021, Chinese imports to the United Kingdom steadily increased. With the EU transition period that ended January 2021, this trend is expected to continue, as 77 percent of chief procurement officers say they have no plan to reduce the value of their sourcing from China leading up to 2025.
To read the article, see “Procurement for prosperity: How UK CPOs can navigate uncertainty and change,” May 18, 2022.
customizer here
Visual form
Animated two-line time-series chart.
Layout / body structure
The graphic is a single chart read left to right from January 2019 to March 2021, with two colored lines sharing the same plotting area. Vertical shaded markers break the timeline at the start of the UK national lockdown and at the end of the transition period, and the note sits underneath the chart.
What is being compared
The chart compares the value of goods the United Kingdom imports from China with the value of goods it exports to China. It sets the two trade flows against the same monthly timeline so the widening gap can be seen directly.
Measurement system
The vertical axis is labeled in pounds sterling, in billions, and the horizontal axis runs month by month from 2019 into early 2021. The two lines use color to distinguish imports from exports rather than splitting the chart into separate panels.
Visible structure inside the graphic
One line climbs sharply through 2020 and stays well above the other by the end of the period, while the export line moves in a lower, flatter band. The shaded event bands and inline labels anchor the viewer to the lockdown shock and the close of the transition period as reference points on the trend.
Main takeaway from the visual
The picture shows UK imports from China strengthening much faster than exports over the same stretch, so the import line finishes the period materially higher than where it began while the export line remains comparatively subdued. The trade relationship is therefore not just recovering after disruption; it is tilting more heavily toward imports.
Key standout values or extremes
The headline calls out a 41.1 percent increase in total goods imports from China to the United Kingdom between January and December 2020. On the plotted scale, the import line rises from a little above £4 billion early in 2020 to around £6 billion by the end of the year, while exports remain far lower throughout the period.
Controls / sequence, when applicable
This is a static chart image with no in-chart controls to operate.
Companion media, when applicable
There is no separate companion audio or video; the chart image is the full visual on this page.