Source page: McKinsey & Company
Commentary
Out-of-this-world aspirations
Aerospace | Space
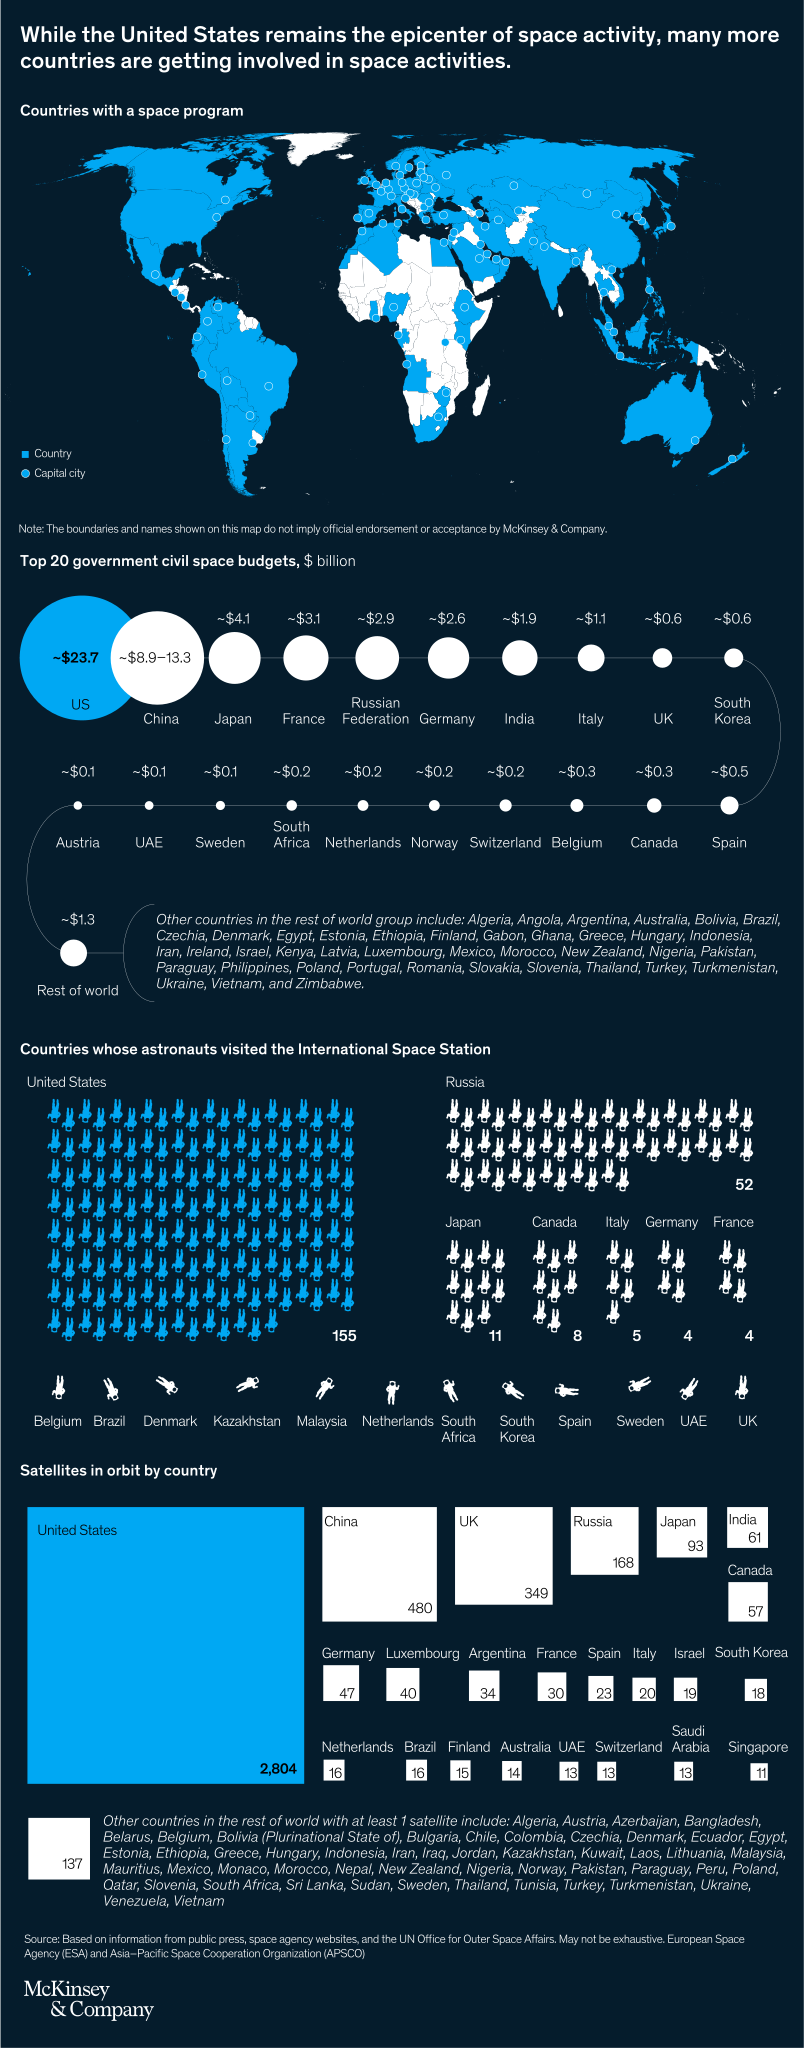
July 27, 2022 – The United States still leads the way in spending on space exploration, but it’s far from the only significant player. About 70 countries now have national space agencies, and 20 nations across four continents have dedicated more than $100 million each in civil space spending annually.
To read the article, see “Space around the globe,” April 20, 2022.
customizer here
Visual form
Multi-section infographic combining a world map, ranked bar chart, pictogram counts, and a treemap.
Layout / body structure
The page is read from top to bottom in four distinct sections. It opens with a world map of countries with a space program, moves to a ranked government civil space budget chart, then to astronaut counts shown with pictograms, and ends with a treemap of satellites in orbit by country.
What is being compared
The infographic compares national participation in space activity across several dimensions: whether a country has a space program, how much governments spend on civil space budgets, how many astronauts countries have produced, and how many satellites each country has in orbit.
Measurement system
The map uses categorical shading for national participation, the budget chart uses dollars in billions, the astronaut section uses simple count labels next to icon rows, and the treemap sizes each country block by its satellite count. Each section therefore keeps its own unit system while still describing the same global race.
Visible structure inside the graphic
The world map establishes geographic spread first, the ranked bar list then shows the top 20 government civil space budgets, the astronaut panel uses repeated figure icons for each country count, and the treemap packs national satellite totals into proportionate rectangles. Because each section uses a different visual grammar, the reader moves from geographic breadth to budget ranking to human participation to orbital assets.
Main takeaway from the visual
The infographic makes clear that the United States still dominates the space economy, but the field is no longer narrow. More countries now have space programs, China is the strongest non-US challenger on budget and satellite counts, and a wider international mix is visible across every section of the page.
Key standout values or extremes
The United States leads the budget section at about $23.7 billion and also leads satellites in orbit at 2,804. China follows with a government civil space budget in roughly the $8.9 billion to $13.3 billion range and 480 satellites, while the astronaut section shows 155 astronauts for the United States versus 52 for Russia and 11 for Japan.
Controls / sequence, when applicable
This is a static chart image with no in-chart controls to operate.
Companion media, when applicable
There is no separate companion audio or video; the chart image is the full visual on this page.