Source page: McKinsey & Company
Commentary
Prices through the roof
Inflation | Economy
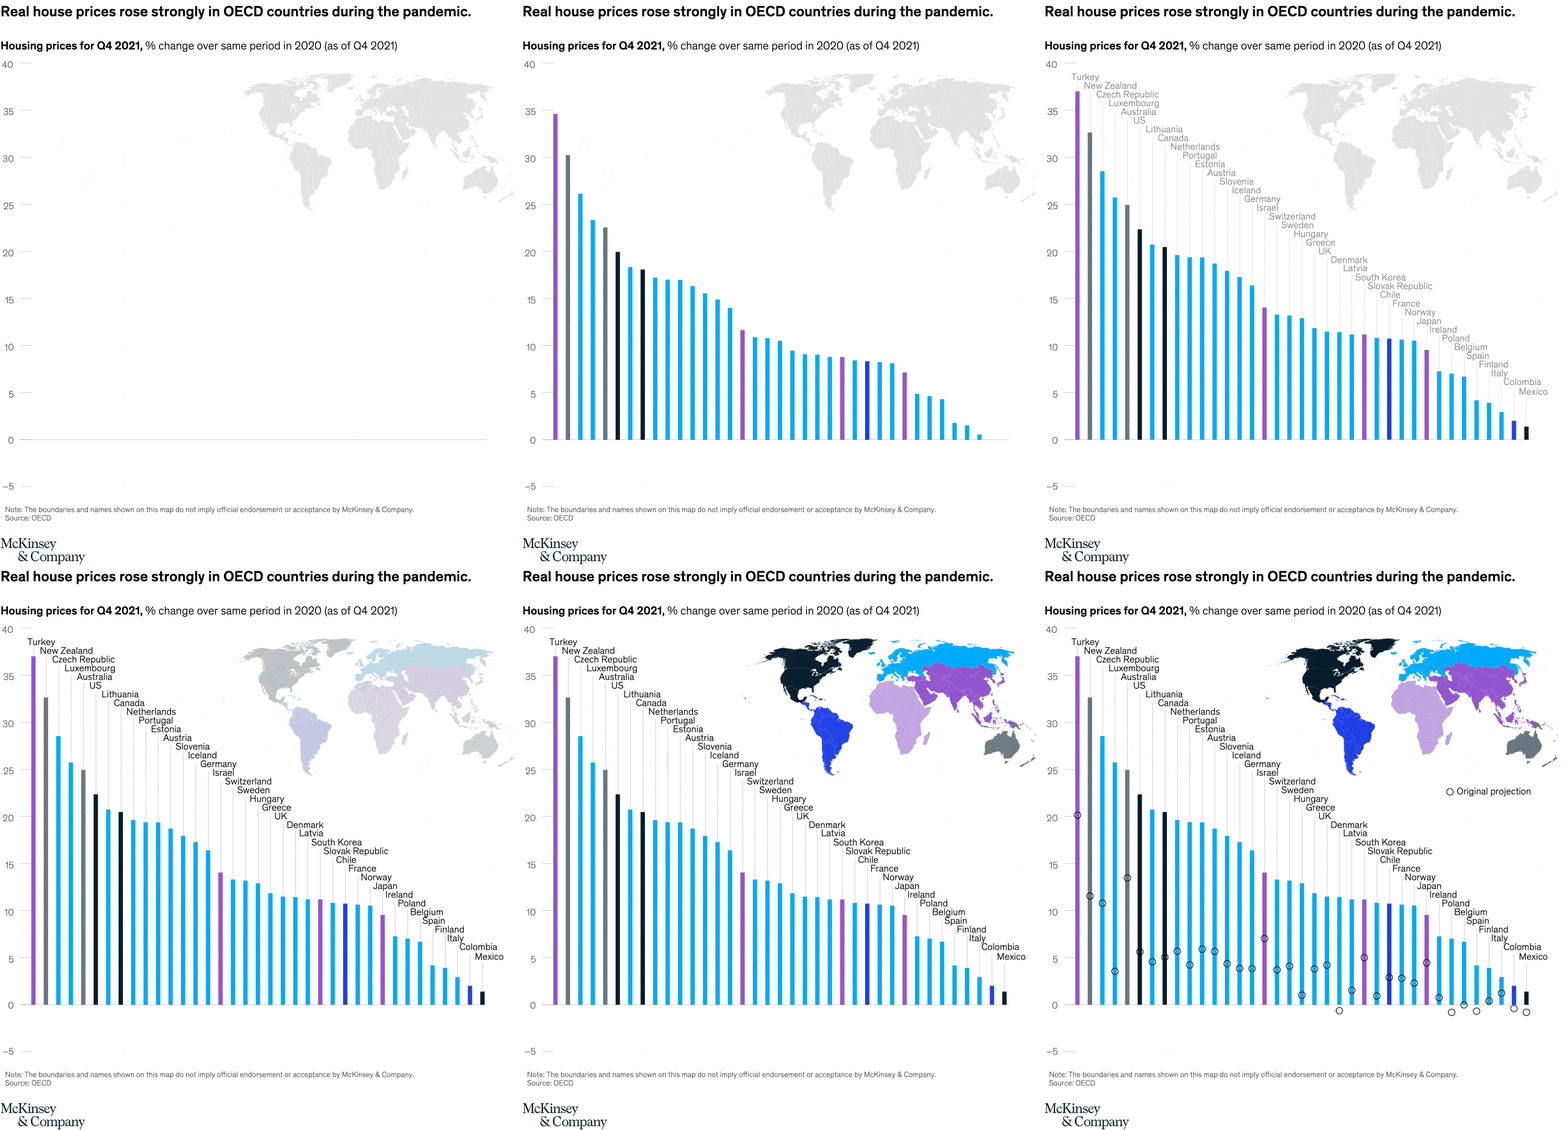
July 21, 2022 – Prior to the onset of inflation this year, housing prices in many countries were already climbing, largely due to pandemic-fueled demand and a dearth of inventory. The real-estate pricing surge was widespread globally, with the highest gains in Turkey and New Zealand.
To read the article, see “How inflation is flipping the economic script, in seven charts,” July 6, 2022.
customizer here
Visual form
Ranked column chart paired with a world map highlight.
Layout / body structure
The main body is a descending set of vertical country columns, read from tallest on the left to shortest on the right. A small world map in the upper-right corner colors the same countries by region, so the viewer can move between the ranking and the geography without leaving the page.
What is being compared
The chart compares real house price growth across OECD countries over the same pandemic period. It shows which countries experienced the sharpest housing price acceleration and which still rose but at a milder pace.
Measurement system
The vertical axis is percentage change in housing prices from the first quarter of 2020 to the fourth quarter of 2021. Each column represents one country, and the map uses regional color coding rather than a second numeric scale.
Visible structure inside the graphic
The columns form a clear left-to-right staircase, with country names angled above the bars as more labels appear. The tallest few bars are far above the rest, while a long middle cluster sits in the low-to-mid teens before the chart tapers down toward low single-digit growth on the right edge.
Main takeaway from the visual
The chart shows that the housing surge was broad, not isolated. Prices rose strongly across much of the OECD, but a few countries pulled decisively ahead of the pack, making the top of the ranking much steeper than the middle of it.
Key standout values or extremes
The tallest column is Turkey at a bit above 30 percent, followed closely by New Zealand near 30 percent. Much of the middle of the ranking falls around the mid-teens, and the smallest columns on the right edge sit only a few percentage points above zero.
Controls / sequence, when applicable
This is a static chart image with no in-chart controls to operate.
Companion media, when applicable
There is no separate companion audio or video; the chart image is the full visual on this page.