Source page: McKinsey & Company
Commentary
Commodities costs see widespread gains
Inflation | Oil & Gas | Food
July 20, 2022 – Supply chains under pressure due to the pandemic became further strained after Russia invaded Ukraine. That conflict has disrupted access to energy sources, crops, and fertilizers, pushing commodities prices well over averages from just a few years prior.
To read the article, see “How inflation is flipping the economic script, in seven charts,” July 6, 2022.
customizer here
Visual form
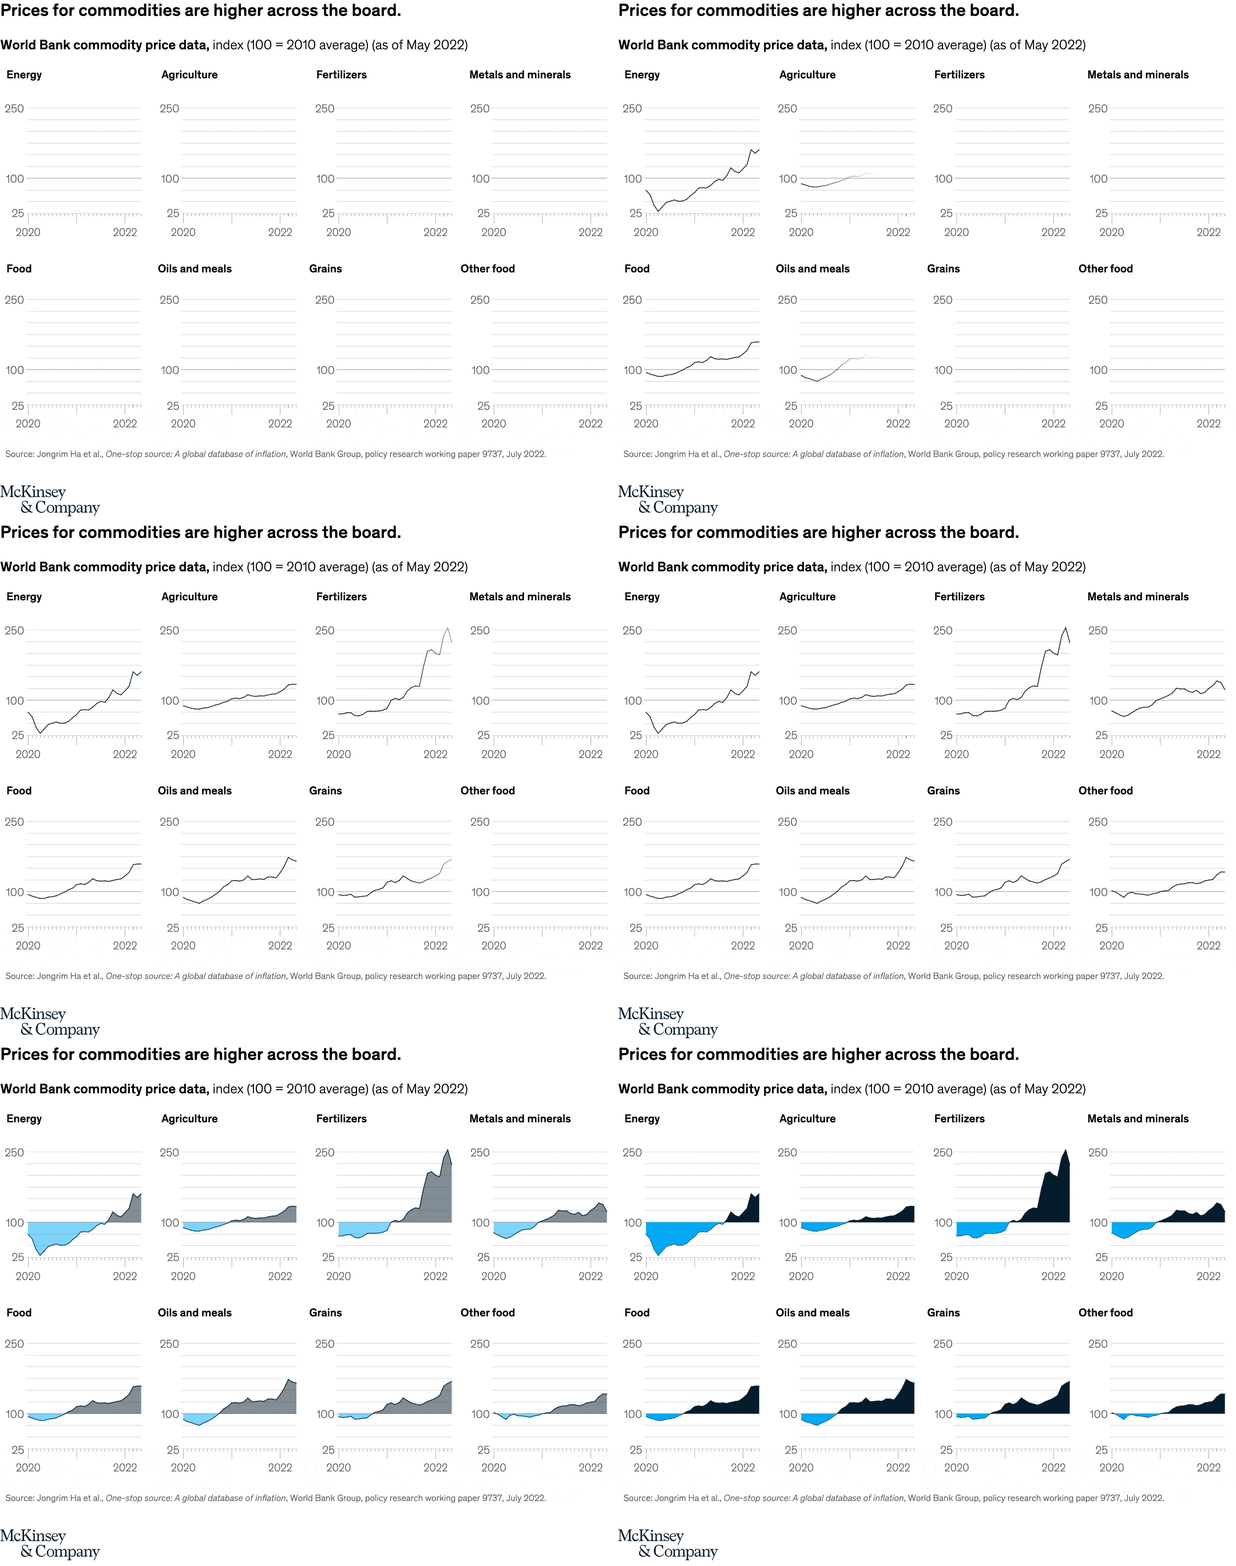
Small-multiple line chart grid.
Layout / body structure
The page lays out eight mini charts in a two-row by four-column grid. The top row reads energy, agriculture, fertilizers, and metals and minerals; the bottom row reads food, oils and meals, grains, and other food, so the reader scans category by category rather than following one combined line.
What is being compared
The chart compares how major commodity categories have moved since 2020, including energy, agricultural inputs, metals, and several food-related groupings. The point is not just that prices are high in one market, but that the rise is spread across the commodity complex.
Measurement system
Each panel uses the same World Bank commodity price index scale, where 100 equals the 2010 average, and the timeline runs from 2020 to 2022. Because the axes are repeated panel by panel, the viewer can compare slope and endpoint height directly across categories.
Visible structure inside the graphic
Every mini chart starts from the same baseline structure and then diverges in slope and peak height. Fertilizers form the steepest and tallest curve by far, energy also surges sharply, and the food-related panels rise more steadily but still finish well above their starting levels.
Main takeaway from the visual
The grid makes clear that commodity inflation is broad-based rather than isolated to one or two inputs. Fertilizers and energy are the most extreme, but every panel ends above its earlier level, which is what makes the shock feel system-wide.
Key standout values or extremes
The fertilizer line climbs above the 250 index level, which is the most dramatic endpoint in the grid. Energy rises to around the 150 range, food finishes around the 130 to 140 range, and even the more moderate categories still end comfortably above the 100 baseline.
Controls / sequence, when applicable
This is a static chart image with no in-chart controls to operate.
Companion media, when applicable
There is no separate companion audio or video; the chart image is the full visual on this page.