Source page: McKinsey & Company
Commentary
Gloomy economic view
Economy | Inflation
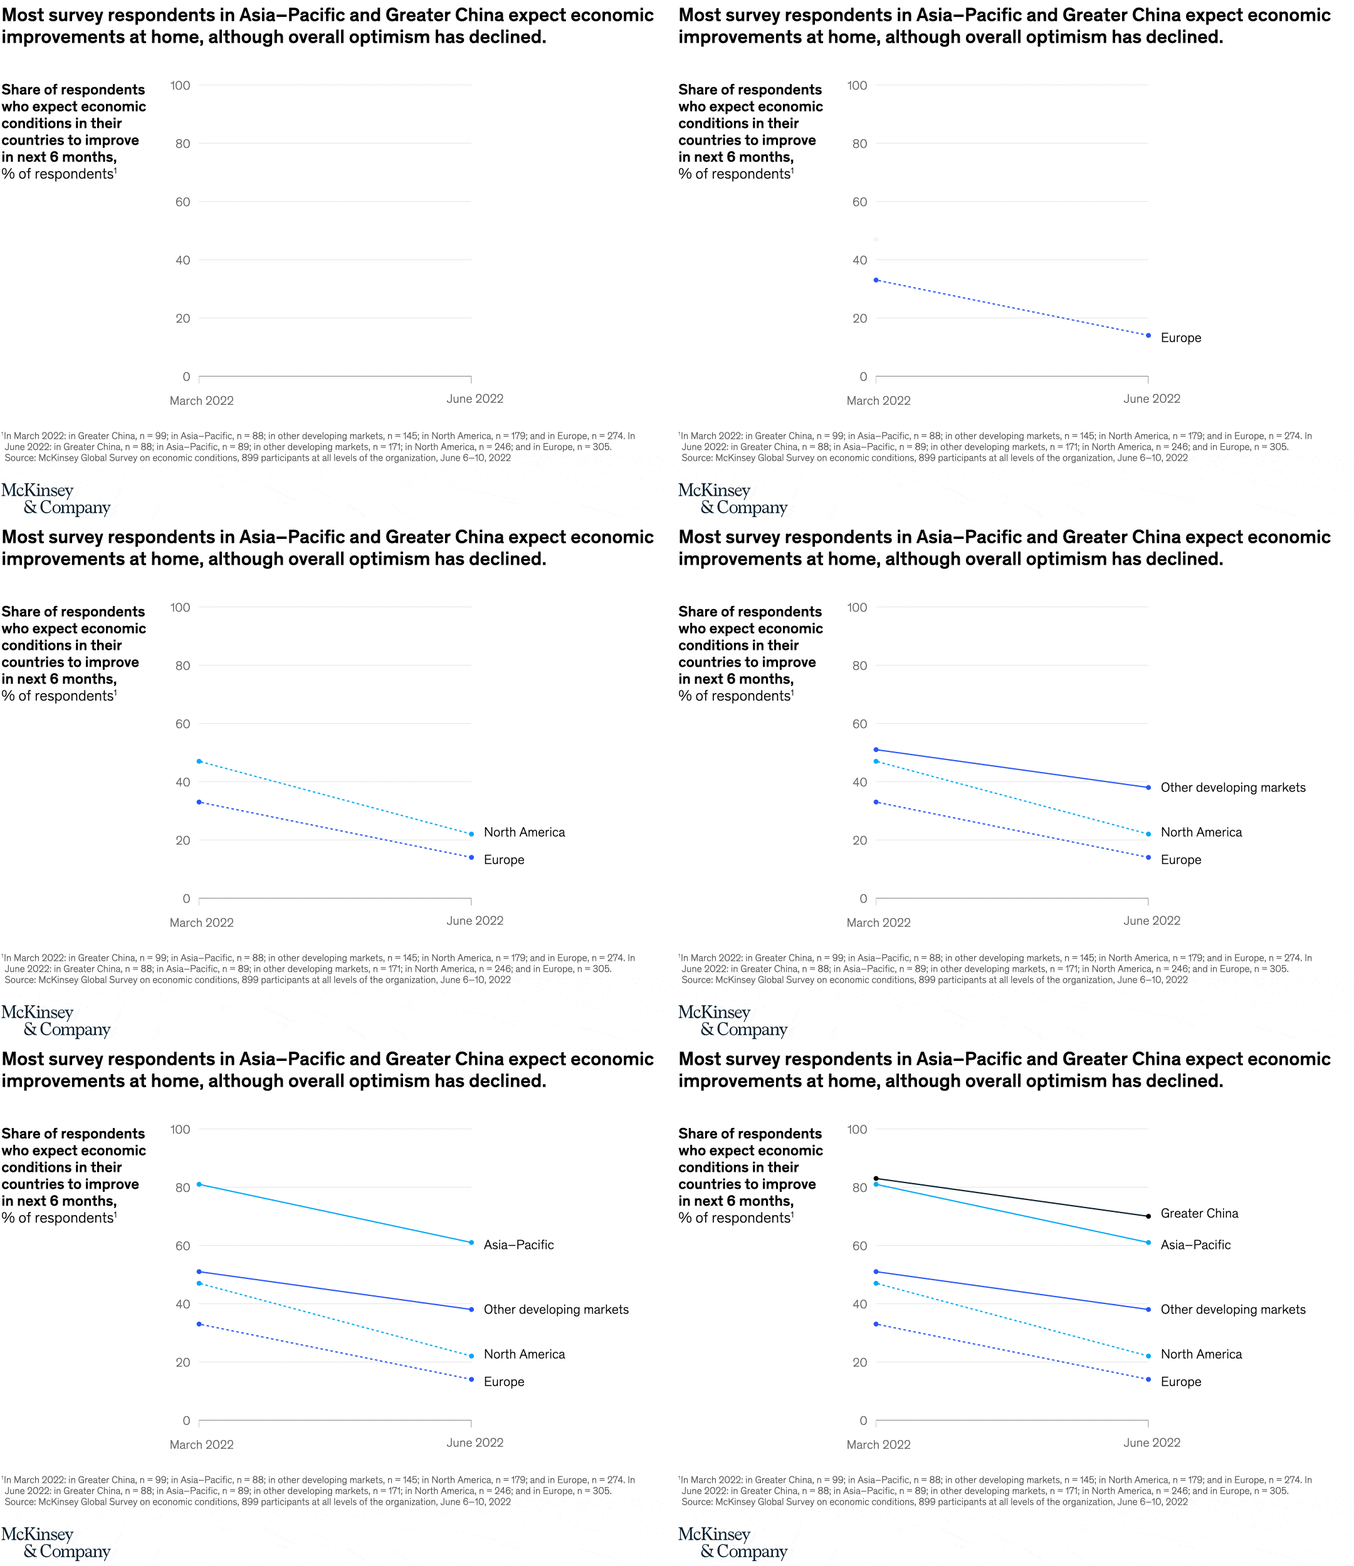
July 15, 2022 – With today’s geopolitical instability, inflation, and supply chain disruptions, economic pessimism is on par with the early months of the pandemic. According to a recent McKinsey survey, most Asia–Pacific and Greater China respondents are optimistic their economies will improve through 2022—although overall optimism has declined—whereas those in Europe and North America are more pessimistic, bracing for the worst.
To read the article, see “The coronavirus effect on global economic sentiment,” June 29, 2022.
customizer here
Visual form
Regional slope chart.
Layout / body structure
The chart is a single panel with two time points, March 2022 and June 2022, connected by straight regional lines. The eye reads each region from left to right, comparing where it starts in March with where it ends in June.
What is being compared
The chart compares the share of survey respondents in different regions who expect economic conditions in their countries to improve in the next six months. It puts Asia-Pacific, other developing markets, North America, Europe, and the June 2022 reading for Greater China into the same optimism frame.
Measurement system
The vertical axis is a percentage of respondents, scaled from 0 to 100, and the horizontal axis is just the two survey dates. The slopes therefore communicate direction and magnitude of sentiment change rather than continuous month-by-month motion.
Visible structure inside the graphic
Every regional line slopes downward, but they begin from different heights and finish at clearly separated June endpoints. Asia-Pacific remains highest on the right edge, Europe sits lowest, and North America and other developing markets occupy the middle band between them.
Main takeaway from the visual
The chart shows optimism falling everywhere, but not evenly. Asia-Pacific still ends in clearly positive territory, whereas Europe and North America finish much lower, which makes the pessimism gap between regions visible at a glance.
Key standout values or extremes
By June 2022, Asia-Pacific still sits around 60 percent, other developing markets around 39 percent, North America around 22 percent, and Europe around 15 percent. Greater China appears near the top of the chart as well, reinforcing that the strongest optimism is concentrated in Asia rather than in Europe or North America.
Controls / sequence, when applicable
This is a static chart image with no in-chart controls to operate.
Companion media, when applicable
There is no separate companion audio or video; the chart image is the full visual on this page.