Source page: McKinsey & Company
Commentary
Greening grocers
Retail | Food | Sustainability
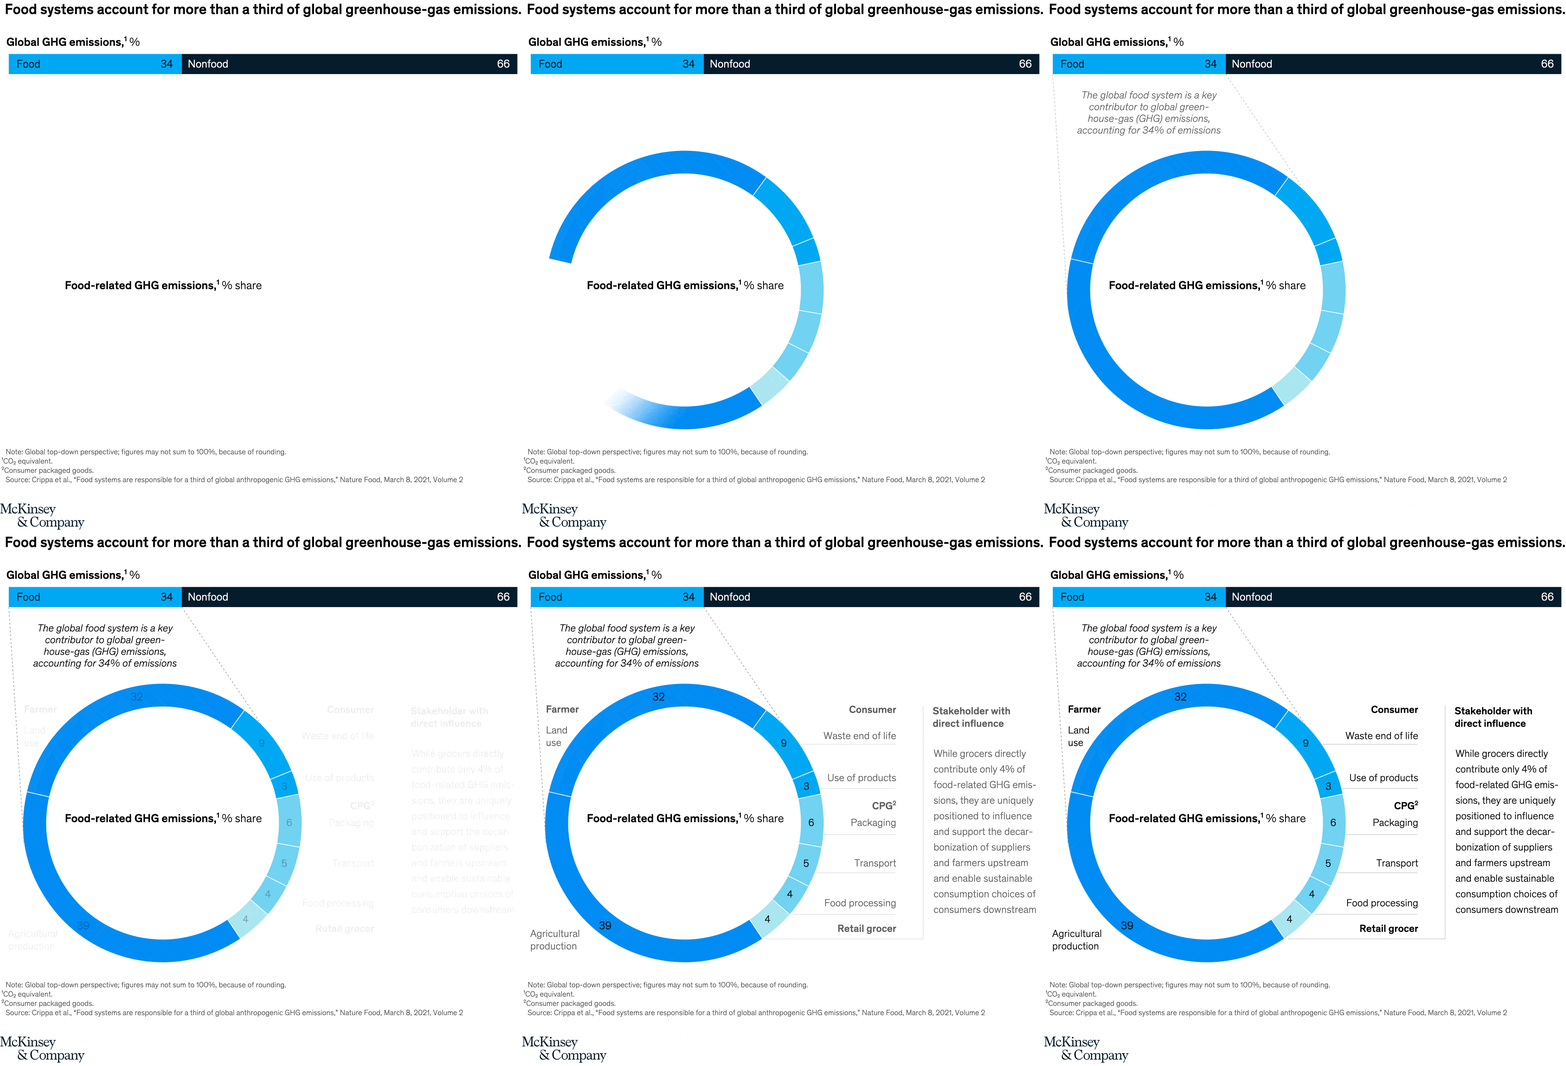
July 14, 2022 – Grocers are in a unique position to help lead on sustainability. The food system accounts for 34 percent of global greenhouse-gas (GHG) emissions. While grocers contribute only about 4 percent of food-related GHG emissions, they have an opportunity to influence and support decarbonization along the value chain, including suppliers and farmers (upstream) and consumer choices (downstream).
To read the article, see “Grocers’ sustainability opportunity in transforming the food system,” May 18, 2022.
customizer here
Visual form
Infographic combining a stacked header bar with a labeled donut breakdown.
Layout / body structure
The page opens with a simple top bar splitting global greenhouse-gas emissions into food and nonfood. Below that sits a large donut chart whose slices are labeled around the ring, so the reader moves from the broad 34-versus-66 split into a finer breakdown of where food-related emissions sit along the value chain.
What is being compared
The infographic compares the total food system share of global emissions with the smaller slices inside that food-system total. It shows how much comes from agricultural production and land use upstream, and how much comes from downstream activities such as transport, packaging, retail grocers, waste, and consumer behavior.
Measurement system
Everything is expressed as a percentage share. The header bar shows food at 34 percent of global greenhouse-gas emissions versus nonfood at 66 percent, and the donut assigns percentage shares to each food-related category inside that 34 percent.
Visible structure inside the graphic
The donut is dominated by two large slices for agricultural production and farmer land use, while a ring of much smaller slices marks transport, packaging, food processing, retail grocers, consumer behavior, and waste. Labels are placed around the outside of the ring, which makes the size difference between upstream sources and downstream sources immediately visible.
Main takeaway from the visual
The infographic shows that food-related emissions matter at global scale, but the biggest chunks sit well upstream of the grocery shelf. Grocers themselves are only a small slice, which is why their influence comes less from their own direct footprint and more from their ability to shape suppliers and consumers.
Key standout values or extremes
The header bar fixes the overall split at 34 percent food and 66 percent nonfood. Inside the donut, agricultural production is the largest slice at 30 percent, farmer land use is next at 12 percent, and retail grocers appear as only about 4 percent of food-related emissions, far smaller than the upstream production slices.
Controls / sequence, when applicable
This is a static chart image with no in-chart controls to operate.
Companion media, when applicable
There is no separate companion audio or video; the chart image is the full visual on this page.