Source page: McKinsey & Company
Commentary
What goes up, slowly comes down
Manufacturing | Climate change | Semiconductors
July 7, 2022 – The manufacturing process for semiconductors creates gases that enter the atmosphere and persist there for years—or tens of thousands of years. Semiconductor producers can consider four abatement levers, such as alternative chemistries and gas recycling, that may help to reduce process-gas emissions.
To read the article, see “Sustainability in semiconductor operations: Toward net-zero production,” May 17, 2022.
customizer here
Visual form
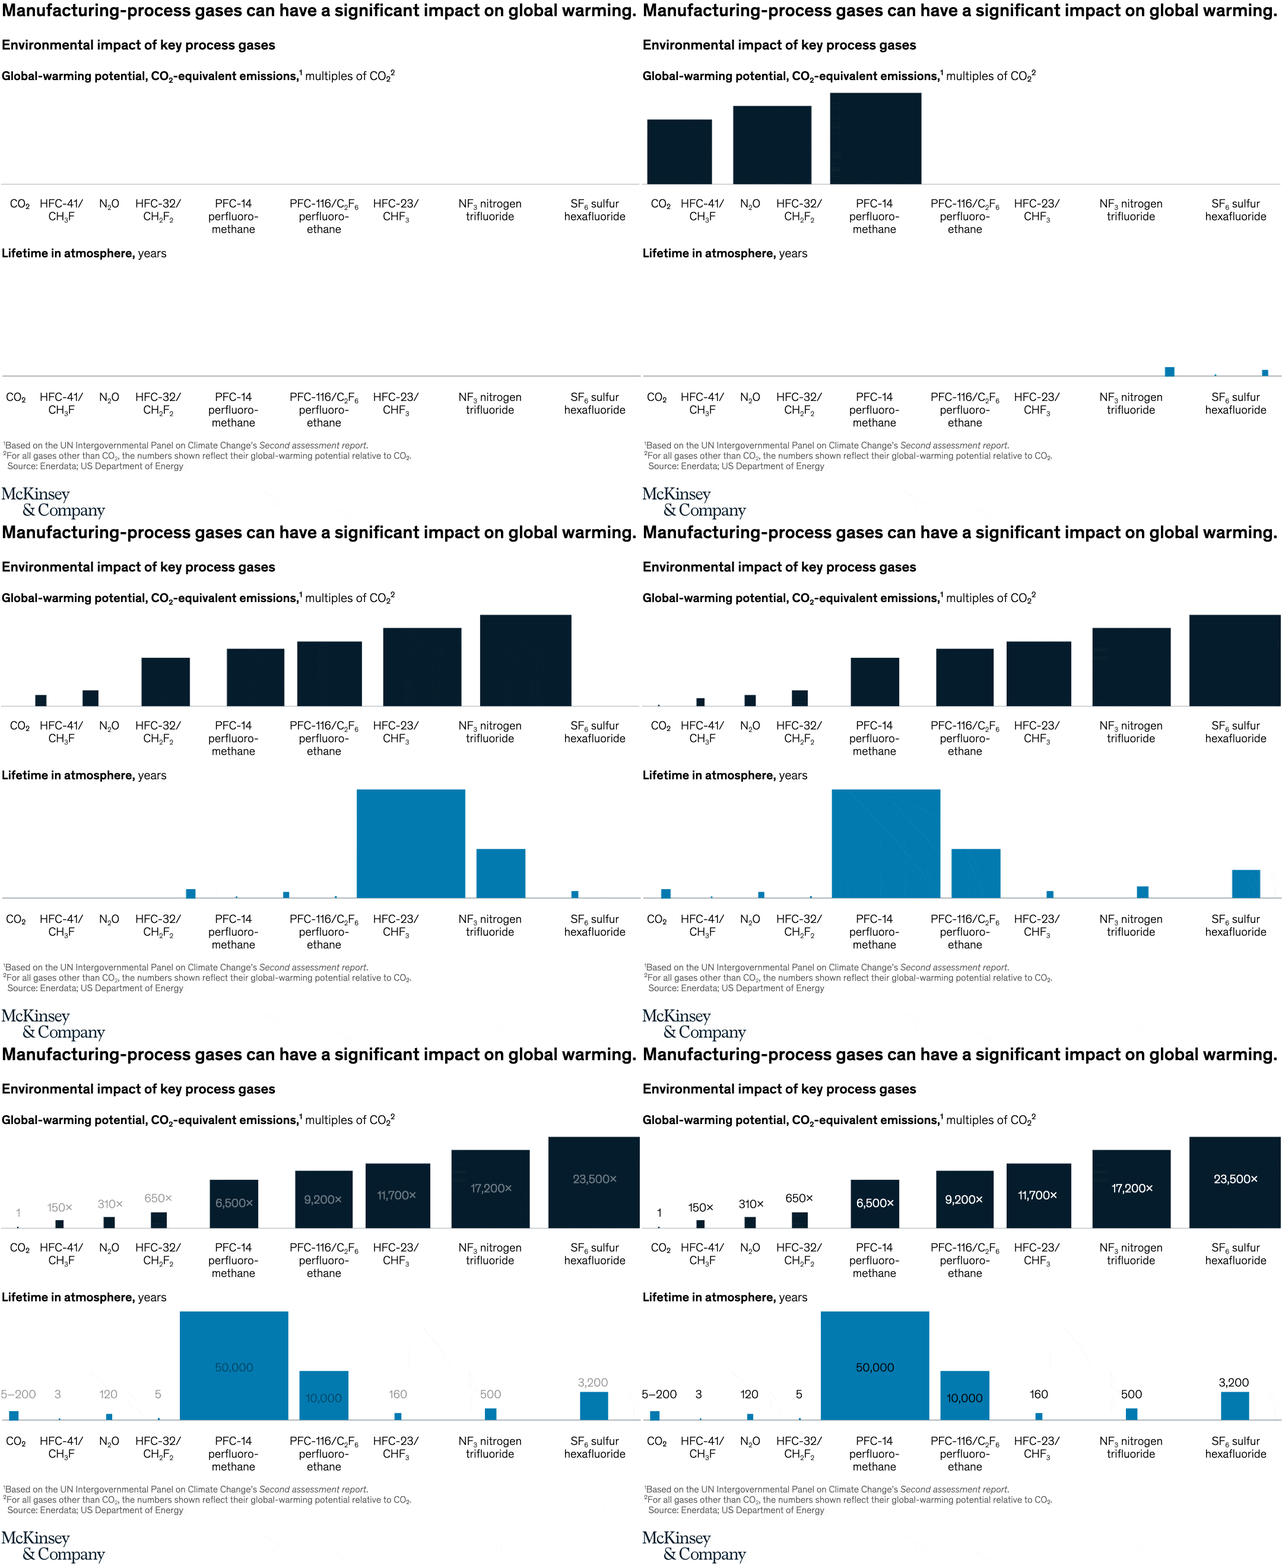
Two-row comparative bar chart.
Layout / body structure
The chart is split into two horizontal bands stacked one above the other. The top row shows global warming potential for several process gases, and the bottom row shows how long those same gases remain in the atmosphere, so the reader compares the same set of categories twice in sequence.
What is being compared
The chart compares key semiconductor process gases across two dimensions: their CO₂-equivalent warming power and their atmospheric lifetime. It shows which gases are especially potent, which persist for very long periods, and which combine both kinds of risk.
Measurement system
The top row is measured in multiples of CO₂ for global warming potential, and the bottom row is measured in years of atmospheric lifetime. Each gas occupies the same category position in both rows, so a viewer can connect potency and persistence directly.
Visible structure inside the graphic
Across the top row the bars rise from very small values on the left to towering bars on the right, with sulfur hexafluoride and nitrogen trifluoride standing out most. In the bottom row, one gas spikes to an extremely long atmospheric lifetime, while several others stay much lower, so the two bands do not peak in exactly the same places.
Main takeaway from the visual
The chart shows why semiconductor process-gas emissions are such a stubborn climate problem: some of these gases are extraordinarily powerful warming agents, some persist for very long periods, and a few sit high on both measures. That means abatement matters even when the absolute gas volumes look small.
Key standout values or extremes
Sulfur hexafluoride is the highest bar on the warming-potential row at about 23,500 times CO₂, and nitrogen trifluoride also sits very high at roughly 17,200. On the lifetime row, one process gas reaches around 50,000 years, while sulfur hexafluoride still stands out at roughly 3,200 years and nitrogen trifluoride at about 500 years.
Controls / sequence, when applicable
This is a static chart image with no in-chart controls to operate.
Companion media, when applicable
There is no separate companion audio or video; the chart image is the full visual on this page.