Source page: McKinsey & Company
Commentary
Eyeing an uptick in risk
Banking | Risk
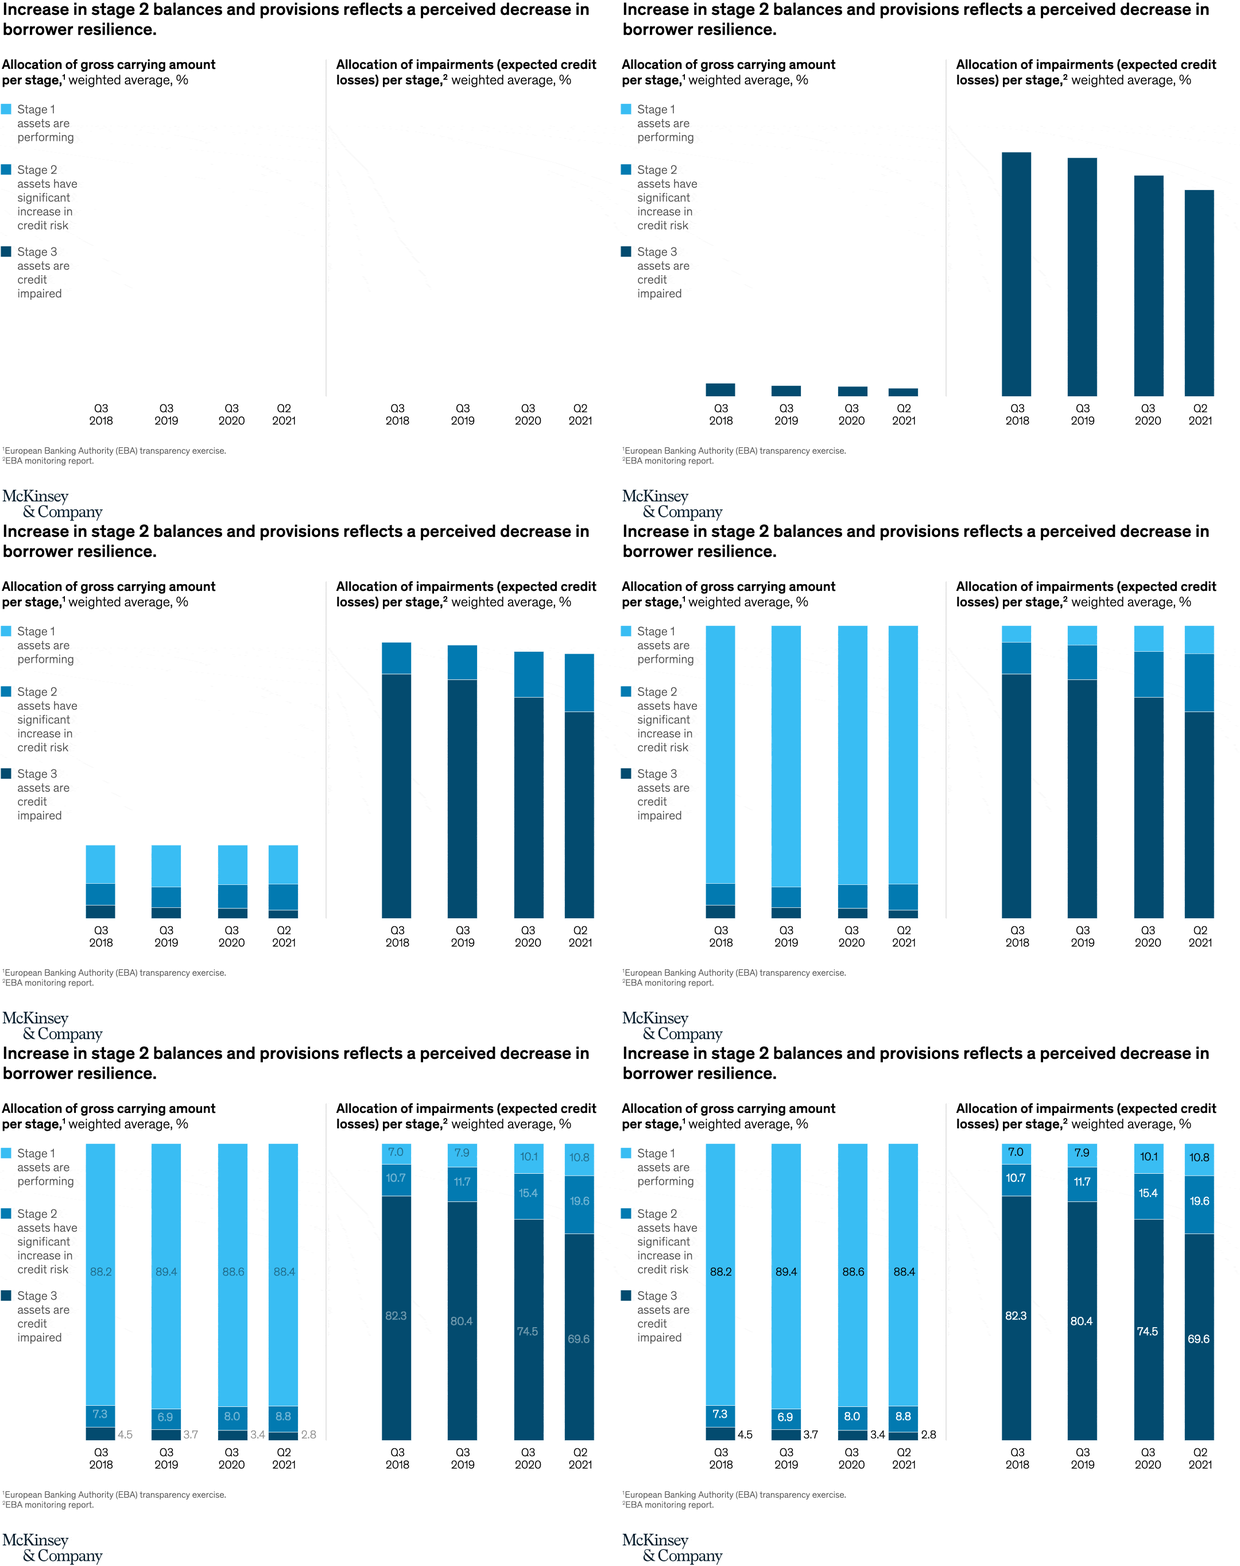
July 6, 2022 – Banks across the globe saw a rise in increased credit risk exposures (stage 2 assets) and in expected credit losses as the COVID-19 pandemic wore on. This uptick in stage 2 proportions indicates a perceived drop in borrower resilience, according to a recent report by the European Banking Authority. And as pandemic-related measures such as moratoria on loan repayments expire, asset quality is likely to be affected.
To read the article, see “IFRS 9 models in financial instruments and impairment regulations: The new reality and lessons learned,” May 23, 2022.
customizer here
Visual form
Two-panel stacked column chart.
Layout / body structure
The page places two aligned panels side by side for the same four dates from Q3 2018 through Q2 2021. The left panel shows the allocation of gross carrying amount by credit stage, and the right panel shows the allocation of impairments or expected credit losses by stage, so the reader compares asset mix and loss mix in parallel.
What is being compared
The chart compares stage 1, stage 2, and stage 3 asset shares with the stage breakdown of impairments over time. It is showing how the overall book remains dominated by stage 1 while a larger share of expected losses shifts toward the higher-risk stage 2 and stage 3 buckets.
Measurement system
Both panels use weighted-average percentage shares, and color is used consistently for stage 1, stage 2, and stage 3. The four time points are quarter labels rather than a continuous monthly series, so the comparison is about stepwise progression across reporting dates.
Visible structure inside the graphic
In the left panel, the stage 1 portion fills almost the entire column in every period, with a small but visibly expanding stage 2 band and a very thin stage 3 strip at the base. In the right panel, stage 1 still holds the biggest share, but stage 2 takes a much larger chunk of the bar than it does on the asset side, which makes the risk migration visible immediately.
Main takeaway from the visual
The chart shows that deterioration is visible first in the stage 2 bucket. Asset balances remain overwhelmingly stage 1, but the stage 2 share rises over time and accounts for a much larger slice of expected losses than of total carrying amount, which signals weaker borrower resilience before full impairment.
Key standout values or extremes
On the gross carrying amount side, stage 1 falls from about 92.8 percent in Q3 2018 to about 88.4 percent by Q2 2021, while stage 2 rises from roughly 4.5 percent to 8.8 percent. On the impairments side, stage 1 drops from about 82.3 percent to 69.6 percent, while stage 2 climbs from roughly 17.0 percent to 19.8 percent and stage 3 reaches around 10.8 percent in 2021.
Controls / sequence, when applicable
This is a static chart image with no in-chart controls to operate.
Companion media, when applicable
There is no separate companion audio or video; the chart image is the full visual on this page.