Source page: McKinsey & Company
Commentary
Sustainable sources for fabs
Sustainability | Semiconductors
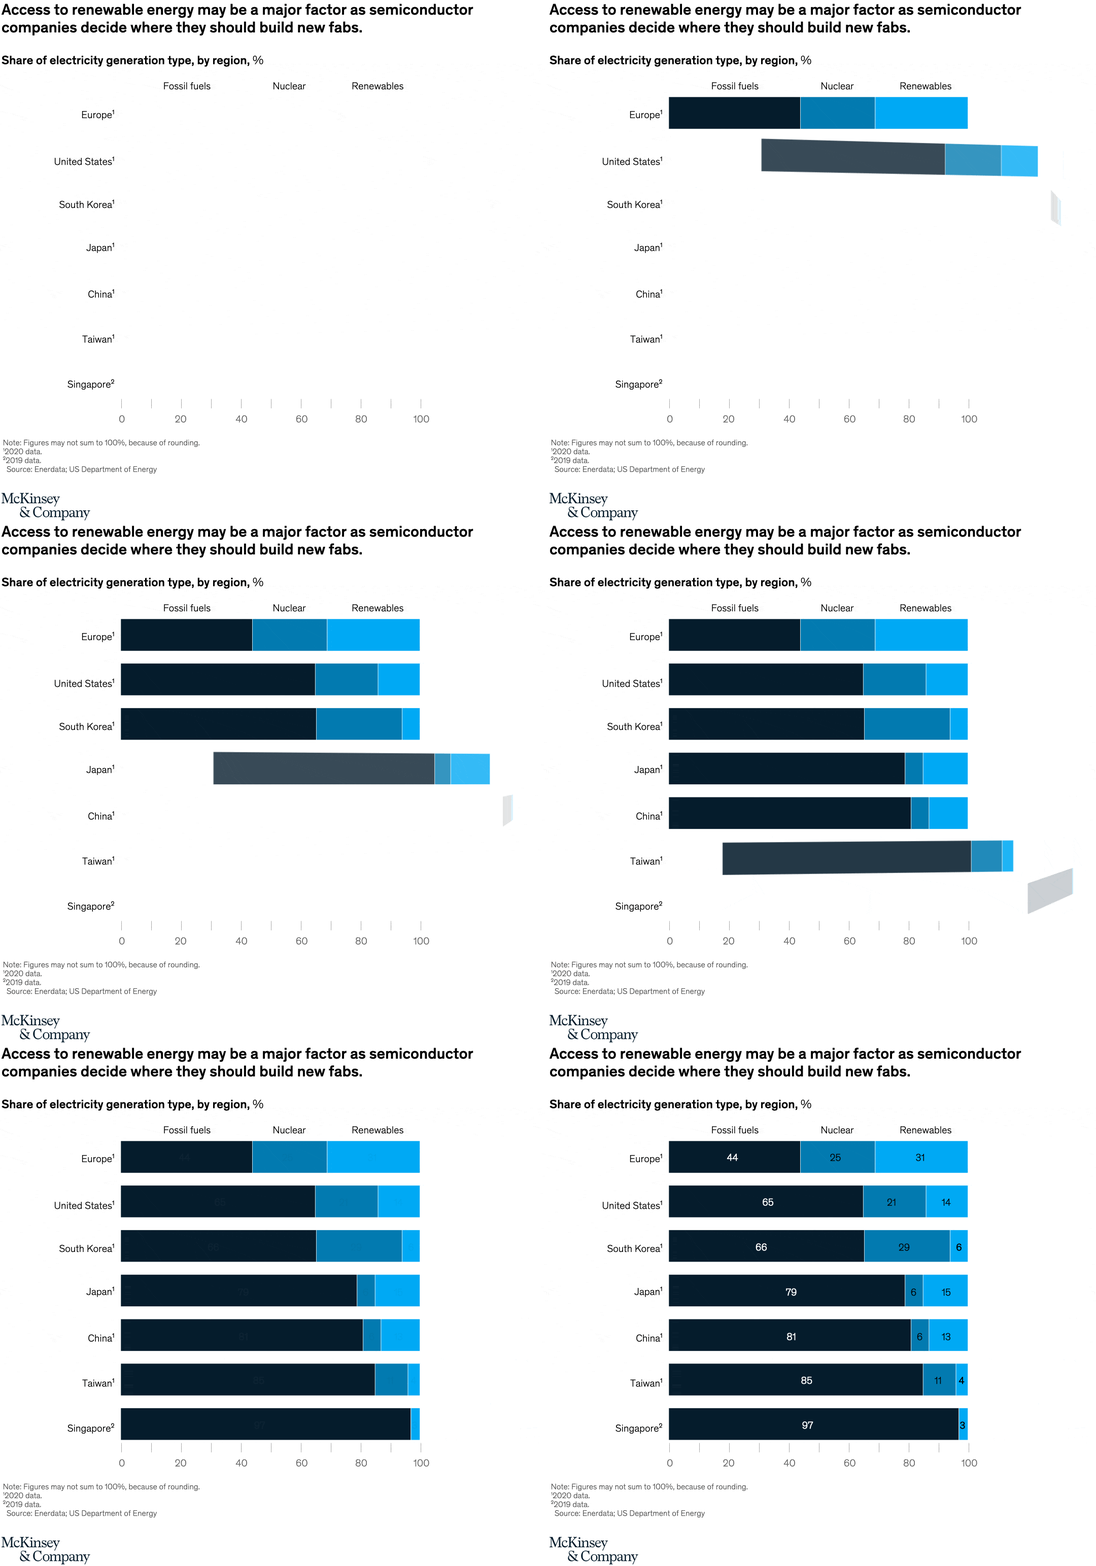
June 30, 2022 – Semiconductor manufacturers are factoring in sustainability considerations as they map out locations for their fabrication plants (fabs). These fabs must pull electricity from a combination of on-grid and off-grid sources. Some regions around the globe, such as Europe and the United States, offer more reliable access to renewable energy than others.
To read the article, see “Sustainability in semiconductor operations: Toward net-zero production,” May 17, 2022.
customizer here
Visual form
Stacked horizontal bar chart by region.
Layout / body structure
The chart lists fab regions vertically and gives each one a single horizontal bar split into fossil fuels, nuclear, and renewables. Reader scans down the regions and across each bar to compare how the electricity mix changes from one geography to another.
What is being compared
The chart compares electricity generation mixes across Europe, the United States, South Korea, Japan, China, Taiwan, and Singapore. It is specifically comparing how much of each region’s power comes from fossil fuels versus low-carbon sources, which matters for semiconductor fab siting.
Measurement system
Each bar is scaled to 100 percent share of electricity generation, with color segments representing fossil fuels, nuclear, and renewables. Because every bar sums to the same total, the visual comparison is about composition rather than absolute volume.
Visible structure inside the graphic
Europe’s bar shows the largest renewable share, with a broad blue renewables segment on the right. The United States and South Korea sit in the middle with more mixed bars, while China, Taiwan, and Singapore are dominated by large dark fossil-fuel segments and only narrow low-carbon slices.
Main takeaway from the visual
The chart shows that access to low-carbon electricity is highly uneven across fab locations. Regions such as Europe offer a much cleaner mix today, while several major semiconductor hubs still rely heavily on fossil generation, which makes sustainability-sensitive siting decisions more constrained.
Key standout values or extremes
Europe is the clearest high-renewable outlier in the set, while China, Taiwan, and Singapore appear at the opposite end with bars dominated by fossil fuels. Japan and South Korea also lean fossil-heavy, but with somewhat larger low-carbon shares than the most carbon-intensive bars at the bottom of the list.
Controls / sequence, when applicable
This is a static chart image with no in-chart controls to operate.
Companion media, when applicable
There is no separate companion audio or video; the chart image is the full visual on this page.