Source page: McKinsey & Company
Commentary
Storage as a power play
Decarbonization | Sustainability
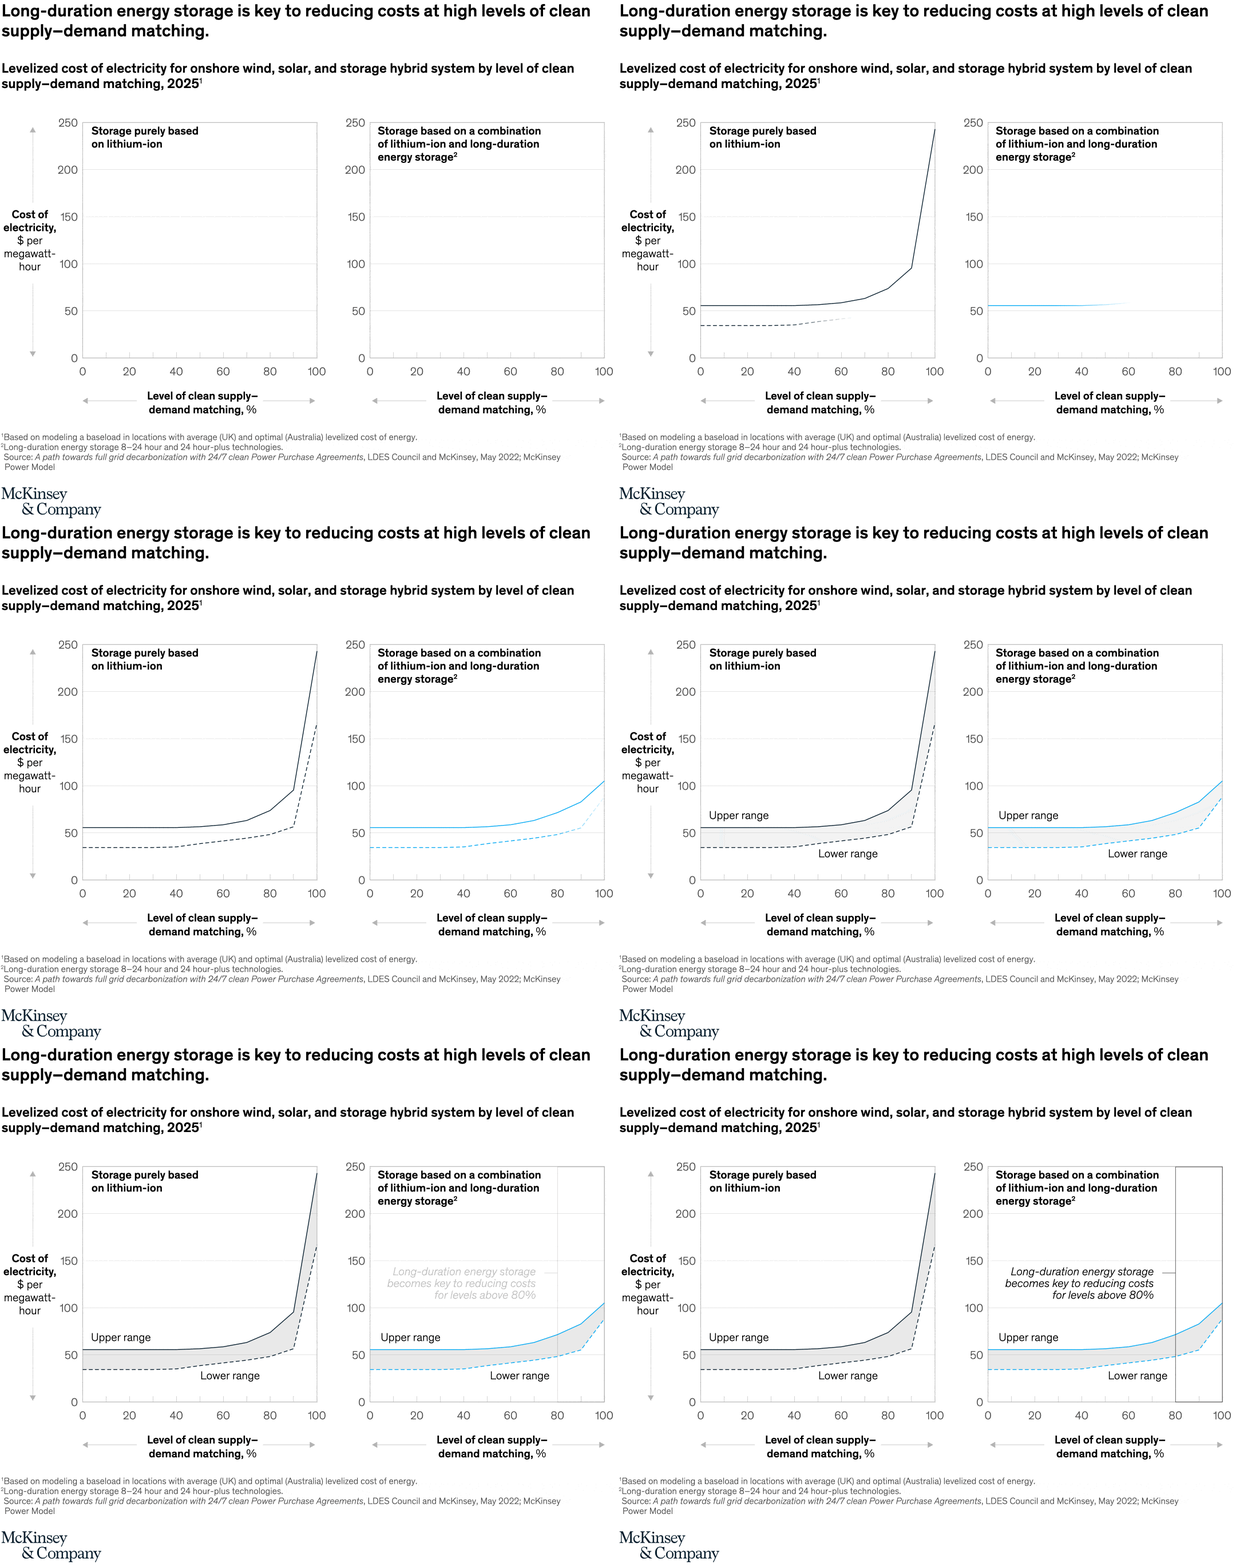
June 28, 2022 – The variability of wind and solar power creates a need to balance supply and demand. Long-duration energy storage (LDES) technologies could potentially smooth out fluctuations in supply and demand by storing energy at times of surplus and releasing it when needed—and, at high levels of supply–demand matching, reduce the costs of renewable power.
To read the article, see “Decarbonizing the grid with 24/7 clean power purchase agreements,” May 11, 2022.
customizer here
Visual form
Two-panel line chart.
Layout / body structure
The chart places two matched panels side by side under the same headline and subtitle. The left panel shows storage built purely on lithium-ion, while the right panel shows storage built on a combination of lithium-ion and long-duration energy storage, so the reader compares the two cost curves directly from left to right.
What is being compared
The chart compares levelized electricity cost against the level of clean supply-demand matching in 2025. It is also comparing two storage strategies, asking how the cost curve changes when the system moves from lithium-ion alone to a hybrid that adds long-duration storage.
Measurement system
The horizontal axis is the level of clean supply-demand matching, shown as a percentage from low levels toward 100 percent. The vertical axis is cost of electricity in dollars per megawatt-hour, and each panel also marks an upper range and lower range around the core curve.
Visible structure inside the graphic
Both panels start relatively flat and then bend upward as matching requirements become more stringent, but the left-hand lithium-ion-only curve turns sharply upward near the far right edge of the chart. The right-hand hybrid panel stays much flatter for longer, and the text annotation that appears in the animation calls out long-duration energy storage as the key driver above the highest matching levels.
Main takeaway from the visual
The chart shows that very high clean-power matching becomes expensive if it relies on lithium-ion alone, but the cost curve softens materially when long-duration storage is added. The visual argument is not just that storage matters, but that long-duration storage becomes decisive once the system pushes past roughly the 80 percent matching zone.
Key standout values or extremes
The left panel’s curve climbs toward the top of a 250-dollar-per-megawatt-hour scale as it approaches the highest matching levels, while the hybrid panel remains far lower at the same far-right end of the chart. The on-chart note specifically marks long-duration energy storage as becoming key for reducing costs at levels above 80 percent.
Controls / sequence, when applicable
This is a static chart image with no in-chart controls to operate.
Companion media, when applicable
There is no separate companion audio or video; the chart image is the full visual on this page.