Source page: McKinsey & Company
Commentary
War and the net-zero transition
Global Trade | Decarbonization | Sustainability
June 23, 2022 – The war in Ukraine is affecting global trade and could complicate the net-zero transition. Ukraine and Russia have significant shares of global trade in many commodities, including key minerals such as copper, nickel, and silicon. These materials are essential inputs to four of the most important net-zero technologies: onshore and offshore wind turbines, solar panels, electric vehicles, and battery storage.
To read the article, see “The net-zero transition in the wake of the war in Ukraine: A detour, a derailment, or a different path?,” May 19, 2022.
customizer here
Visual form
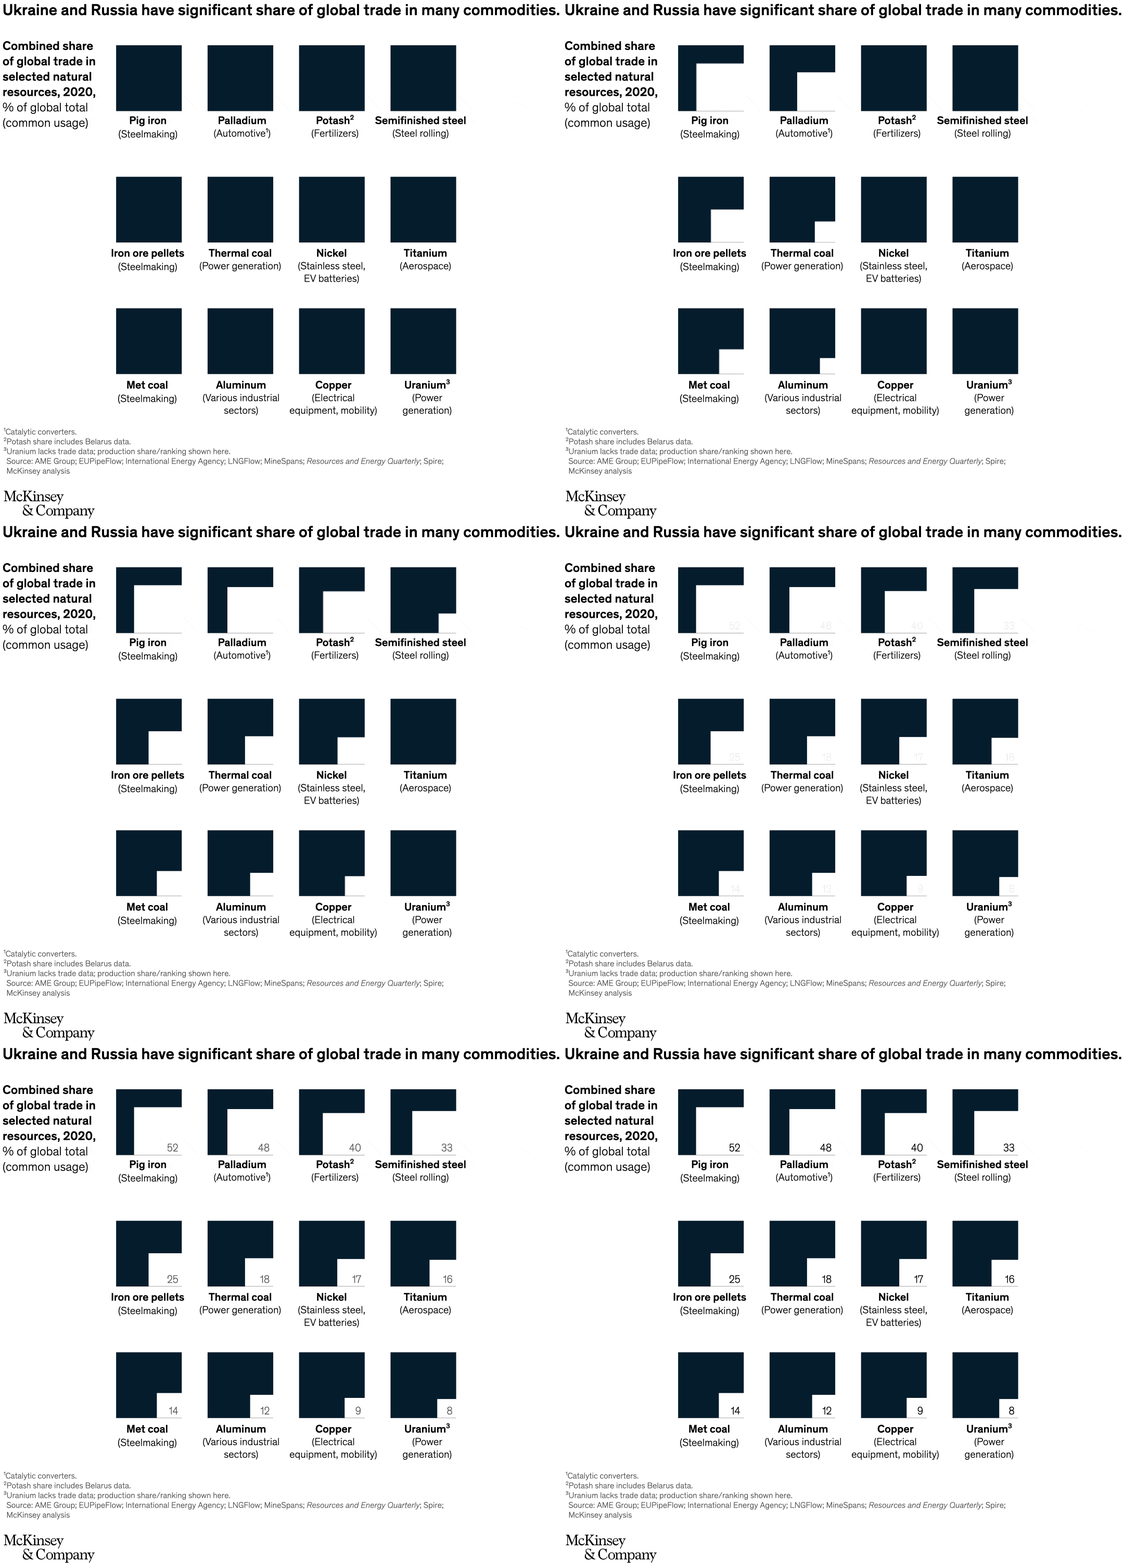
Small-multiple share infographic built as a 3×4 grid of commodity tiles.
Layout / body structure
The chart is a single page of twelve equal-size tiles arranged left to right and top to bottom. Each tile uses the same square frame and the reader scans the grid commodity by commodity rather than following an axis.
What is being compared
The graphic compares the combined Ukraine-and-Russia share of global trade across selected natural resources and industrial inputs in 2020. Each tile represents one commodity, so the comparison is commodity versus commodity rather than one time series versus another.
Measurement system
The metric is percent of global total, labeled inside each tile as the combined share of global trade in common usage for that commodity. The values are direct percentages, so larger filled shapes and larger labels signal greater dependence on trade from the two countries.
Visible structure inside the graphic
Each commodity tile pairs a label with a large percentage and an L-shaped filled corner inside a square frame. The repeated tile design makes it easy to compare how much of the square is occupied for pig iron, palladium, potash, semifinished steel, iron ore pellets, thermal coal, nickel, titanium, met coal, aluminum, copper, and uranium.
Main takeaway from the visual
The strongest visual takeaway is concentration: several commodities sit at strikingly high combined trade shares, so the war hits multiple supply chains at once instead of creating a single isolated shortage. The top row in particular shows how exposed some industrial and transition materials are to disruption in Ukraine and Russia.
Key standout values or extremes
Pig iron is the most exposed tile at 52 percent, followed by palladium at 48 percent and potash at 40 percent. Semifinished steel reaches 33 percent, iron ore pellets 25 percent, thermal coal 18 percent, nickel 17 percent, titanium 16 percent, met coal 14 percent, aluminum 12 percent, copper 9 percent, and uranium 8 percent.
Controls / sequence, when applicable
This is a static chart image with no in-chart controls to operate.
Companion media, when applicable
There is no separate companion audio or video; the chart image is the full visual on this page.