Source page: McKinsey & Company
Commentary
The revolution is digital
Digital | Operations
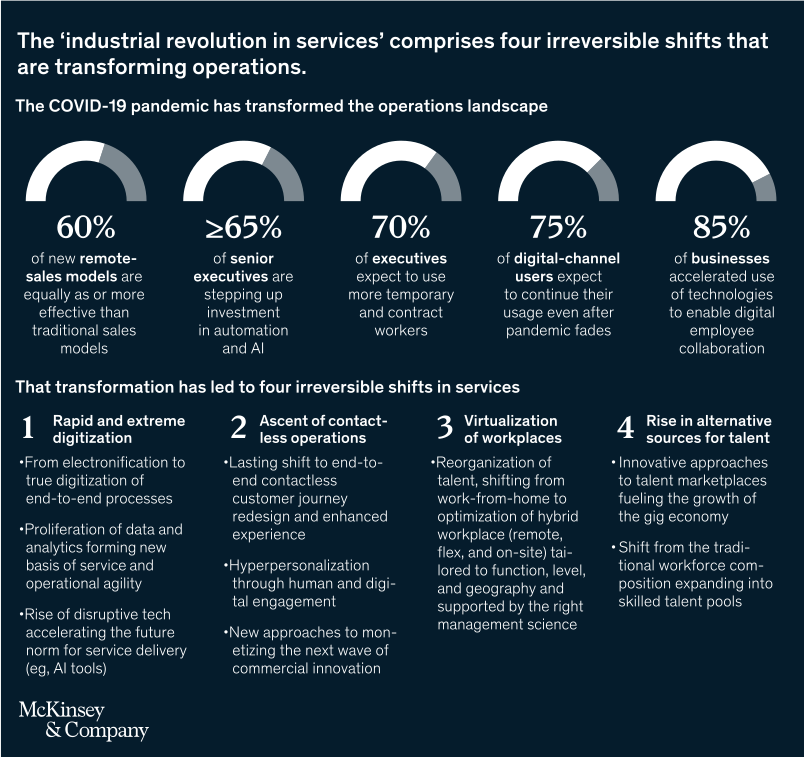
June 21, 2022 – The COVID-19 pandemic led to rapid and extreme digitization in many sectors, as organizations moved from technology enablement of legacy operations to full digitization. Meanwhile, 85 percent of respondents to a 2020 global survey of executives said their businesses have accelerated use of technologies to enable digital employee collaboration.
To read the article, see “Fueling digital operations with analog data,” April 20, 2022.
customizer here
Visual form
Hybrid infographic combining semicircle gauges with a four-column framework.
Layout / body structure
The page is split into two stacked zones: a top band of five semicircle gauges and a lower band of four numbered text columns. Reader moves across the five percentage gauges first and then reads the four irreversible shifts from left to right below them.
What is being compared
The top row compares five digital-operations signals that accelerated during the pandemic, while the bottom row groups the operational consequences into four structural shifts in services. Instead of plotting one shared axis, the chart compares prevalence, adoption, and organizational change across separate but related themes.
Measurement system
The top band uses percentages and one threshold marker, >=65 percent, to quantify the share of executives, businesses, or digital-channel users associated with each shift. The lower band is categorical rather than numeric, using numbered sections and bullet lists to describe the four transformation areas.
Visible structure inside the graphic
Five white-and-gray semicircle gauges sit across the top with large labels of 60 percent, >=65 percent, 70 percent, 75 percent, and 85 percent, each paired with a short caption. Beneath them, four numbered columns describe rapid and extreme digitization, ascent of contactless operations, virtualization of workplaces, and rise in alternative sources for talent, with bullet points under each heading.
Main takeaway from the visual
The chart shows that the pandemic did not just raise one adoption metric; it pushed multiple parts of operations into a new baseline at the same time. The high percentages across all five gauges feed directly into the four-column framework below, which presents the shift as broad operational redesign rather than a temporary spike.
Key standout values or extremes
The largest gauge is 85 percent for businesses accelerating technologies that enable digital employee collaboration. Other headline values are 75 percent of digital-channel users expecting to continue their usage, 70 percent of executives expecting more temporary and contract workers, >=65 percent of senior executives stepping up investment in automation and AI, and 60 percent of new remote-sales models proving equally or more effective than traditional ones.
Controls / sequence, when applicable
This is a static chart image with no in-chart controls to operate.
Companion media, when applicable
There is no separate companion audio or video; the chart image is the full visual on this page.