Source page: McKinsey & Company
Commentary
Diagnosis? Stalled growth
Life Sciences | Growth
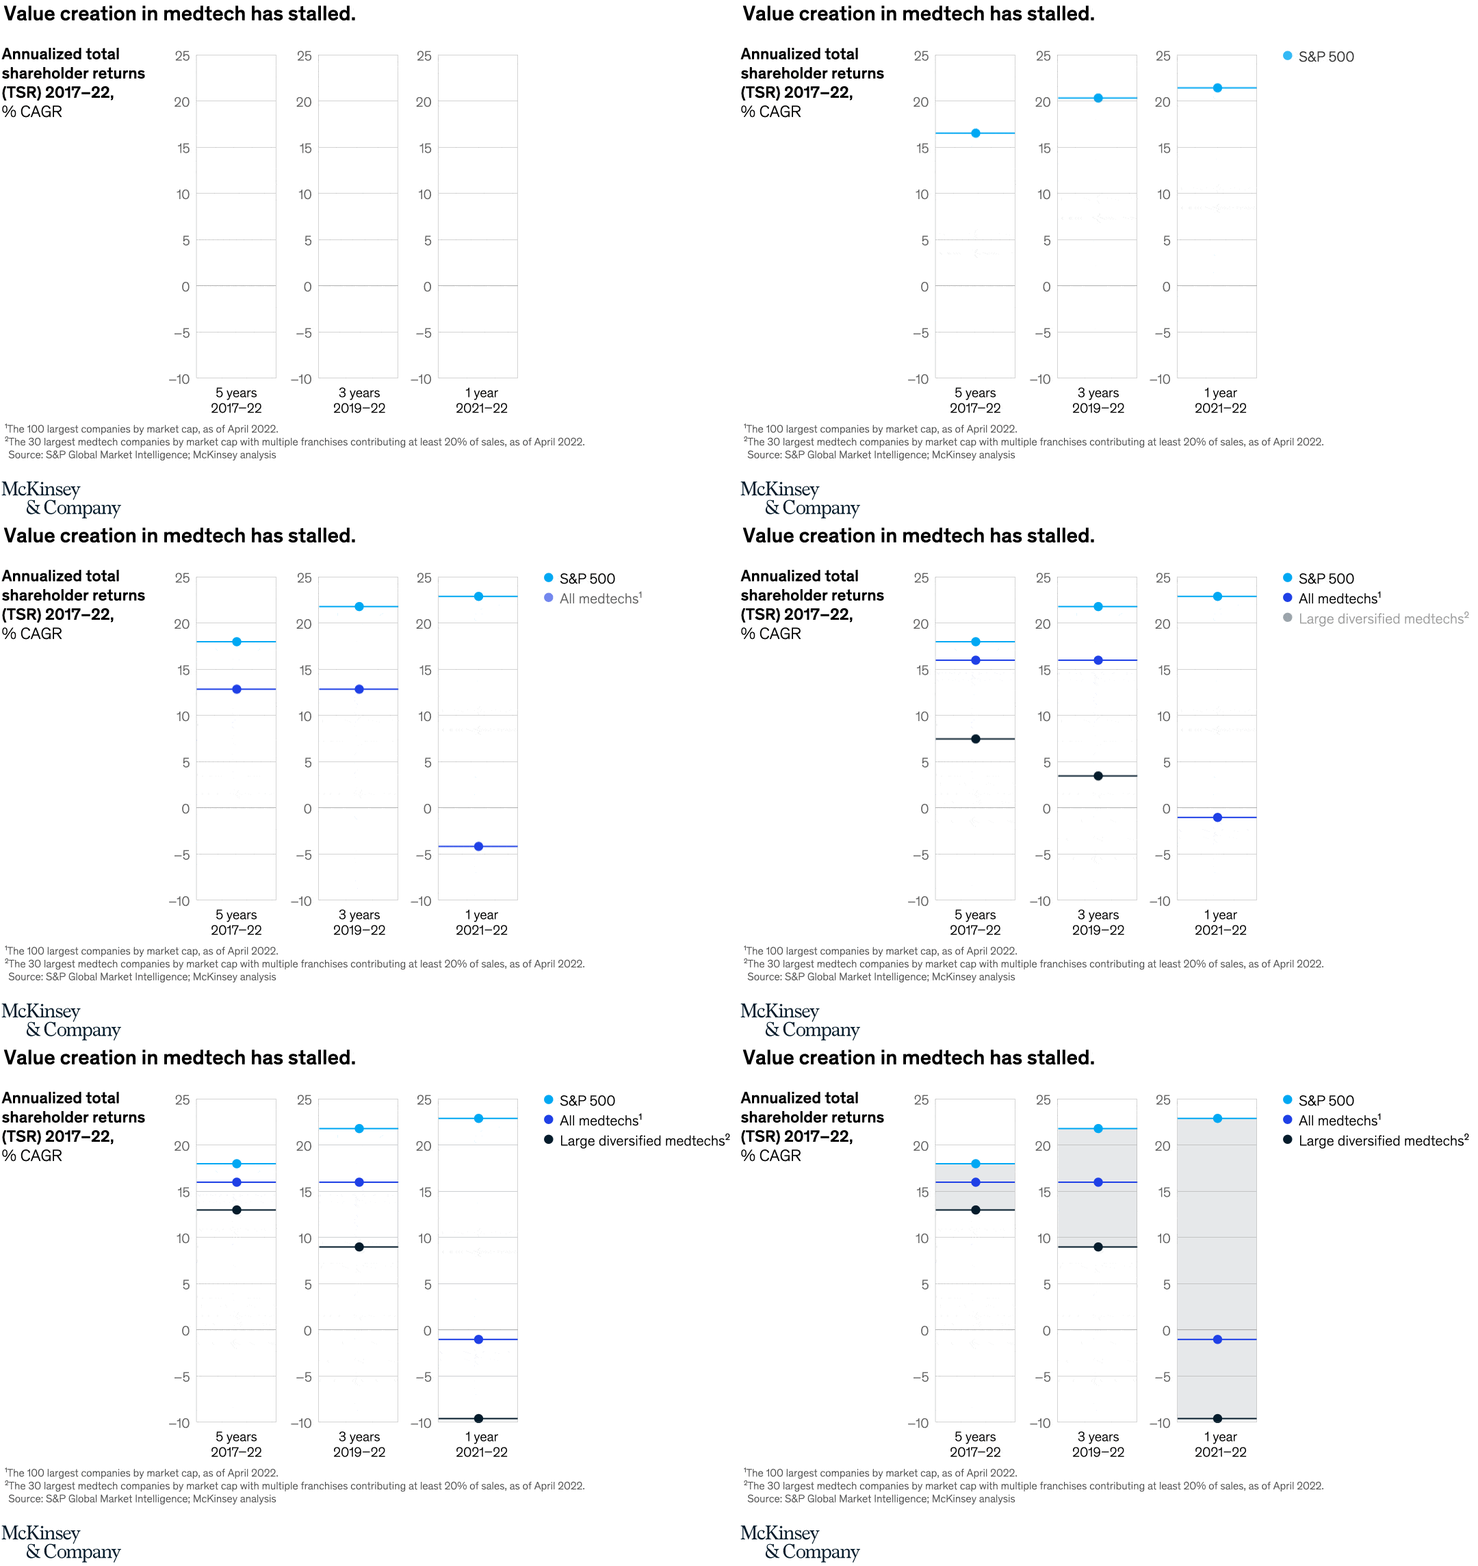
June 10, 2022 – Creating value in medtech has become a challenge, particularly for large diversified companies. As an example, the top 30 cross-category companies in the industry have underperformed the S&P over one-, three-, and five-year periods.
To read the article, see “Accelerating growth in medtech: The next surge in portfolio moves,” May 10, 2022.
customizer here
Visual form
Three-panel benchmark dot plot.
Layout / body structure
The page is arranged as three narrow vertical comparison columns placed side by side for five years, three years, and one year. Read left to right across the three time windows while matching the colored dots and horizontal reference lines to the legend on the right.
What is being compared
Each panel compares annualized total shareholder returns for the S&P 500, all medtechs, and large diversified medtechs over 2017 – 22, 2019 – 22, and 2021 – 22.
Measurement system
The y-axis is percent CAGR, running from about -10 to 25. The cyan series marks the S&P 500, the blue series marks all medtechs, and the dark navy series marks large diversified medtechs.
Visible structure inside the graphic
Every time window is shown as a tall shaded column with three colored dots placed at their return levels and matching horizontal guide lines extending across the panel. The panels share the same vertical scale, so the drop from positive to negative returns is easy to compare across the three windows.
Main takeaway from the visual
The visual shows medtech lagging the broader market in every time frame, with the short-term picture deteriorating the most. Large diversified medtechs are the weakest line in all three panels and move deep into negative territory in the one-year view.
Key standout values or extremes
Over five years, the S&P 500 is about 18 percent CAGR, all medtechs about 16 percent, and large diversified medtechs about 13 percent. Over three years the spread widens to roughly 22, 16, and 9 percent, and over one year the S&P 500 is about 23 percent while all medtechs fall to about -1 percent and large diversified medtechs to roughly -10 percent.
Controls / sequence, when applicable
This is a static chart image with no in-chart controls to operate.
Companion media, when applicable
There is no separate companion audio or video; the chart image is the full visual on this page.