Source page: McKinsey & Company
Commentary
Power forward
Renewable energy | Climate change | Sustainability
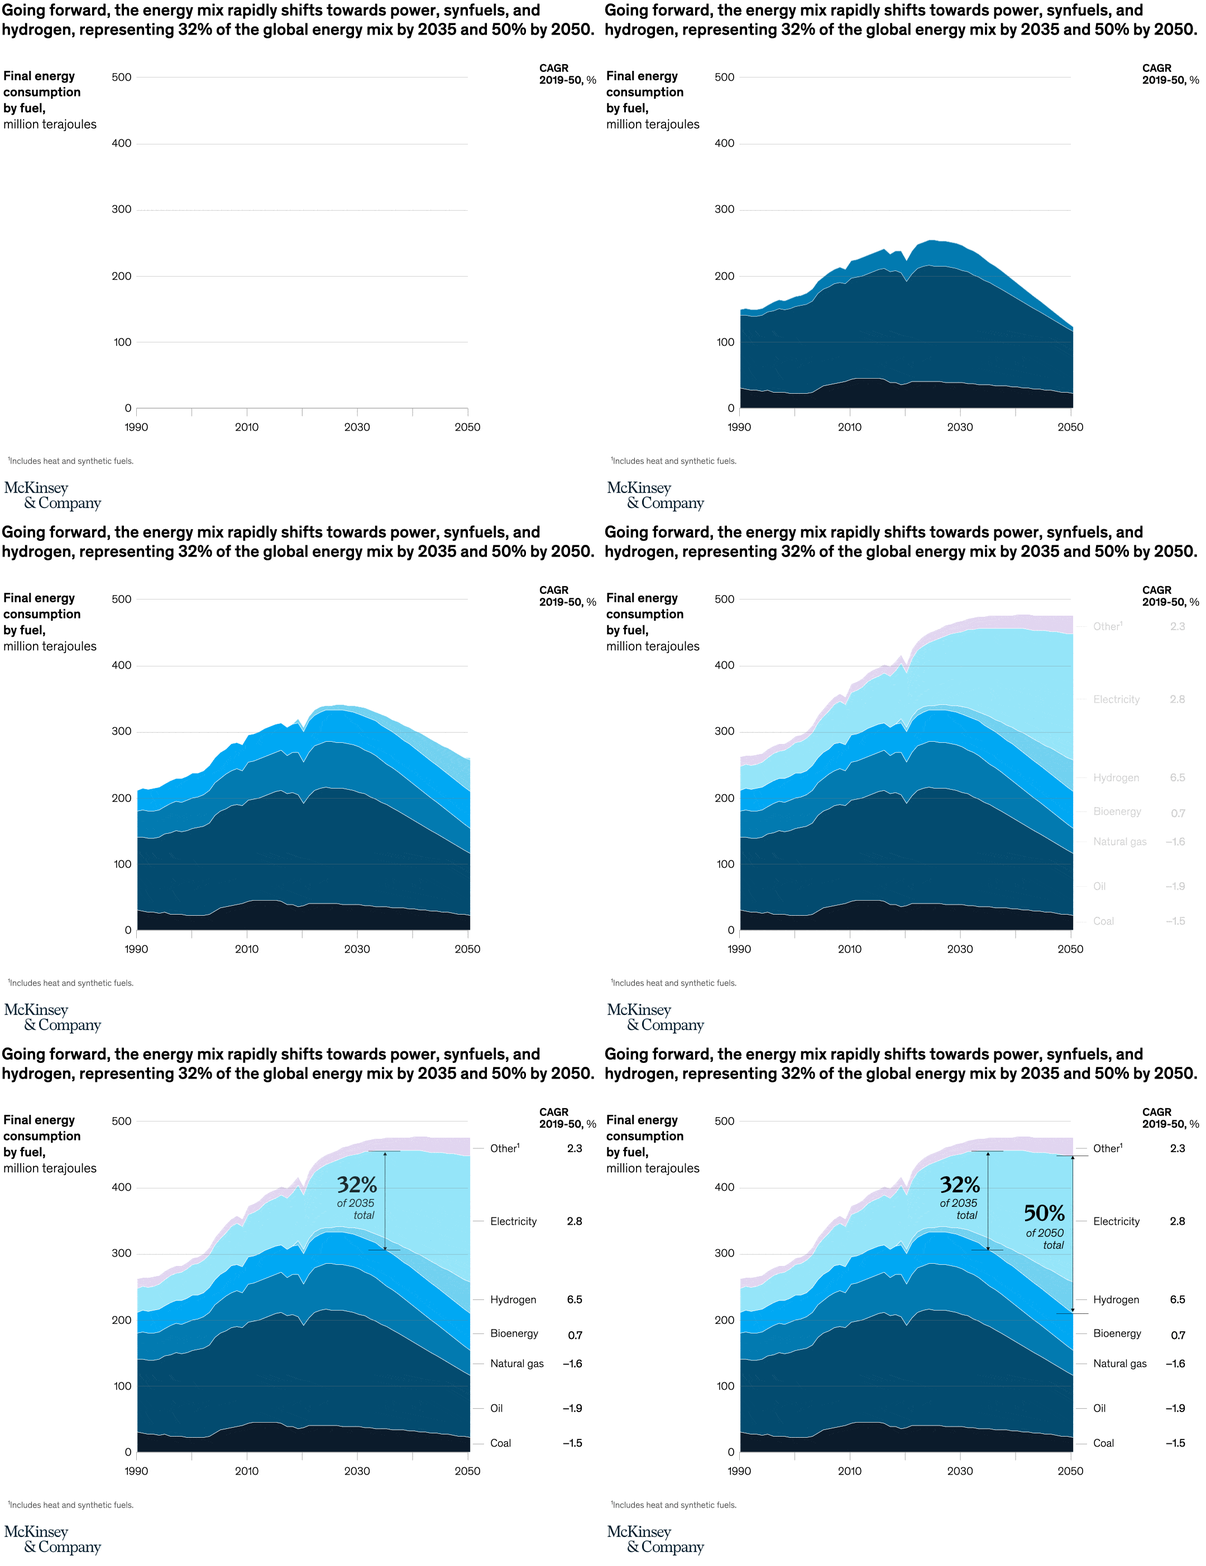
June 6, 2022 – The transition to a lower-carbon energy system will accelerate in the coming decades. As that happens, the energy mix could shift rapidly toward electricity and hydrogen, which together could represent 32 percent of global energy by 2035 and 50 percent by 2050.
To read the report, see “Global Energy Perspective 2022,” April 26, 2022.
customizer here
Visual form
Stacked area chart.
Layout / body structure
The chart is one long time-series chart running from 1990 to 2050, with the fuel bands stacked from bottom to top and the CAGR legend set off on the right. Read the fuel mix across time first, then use the right-side labels and the 2035 and 2050 callouts to interpret the shift.
What is being compared
The chart compares final energy consumption by fuel over time, tracking coal, oil, natural gas, bioenergy, hydrogen, electricity, and other energy sources as the global mix evolves.
Measurement system
The vertical scale is million terajoules, while the right margin lists CAGR from 2019 to 2050 for each fuel. Two large callouts mark the combined share of power, synfuels, and hydrogen at 32 percent of total energy by 2035 and 50 percent by 2050.
Visible structure inside the graphic
A dark fossil-fuel base narrows over time while lighter blue and aqua bands for hydrogen and electricity expand sharply toward the right edge. The right-hand labels tie each band to its fuel category and pair that label with a growth rate or decline rate.
Main takeaway from the visual
The visual shows the energy mix tilting away from coal, oil, and natural gas and toward electricity and hydrogen, with the low-carbon share becoming a much larger slice of the total by 2035 and then half of the entire mix by 2050. Electricity grows steadily while hydrogen scales the fastest from a much smaller starting base.
Key standout values or extremes
The chart highlights power, synfuels, and hydrogen reaching 32 percent of total energy by 2035 and 50 percent by 2050. On the right, hydrogen has the strongest CAGR at 6.5 percent and electricity grows at 2.8 percent, while natural gas, oil, and coal decline at about -1.6 percent, -1.9 percent, and -1.5 percent respectively.
Controls / sequence, when applicable
This is a static chart image with no in-chart controls to operate.
Companion media, when applicable
There is no separate companion audio or video; the chart image is the full visual on this page.