Source page: McKinsey & Company
Commentary
The art of talent retention
Organization | Talent
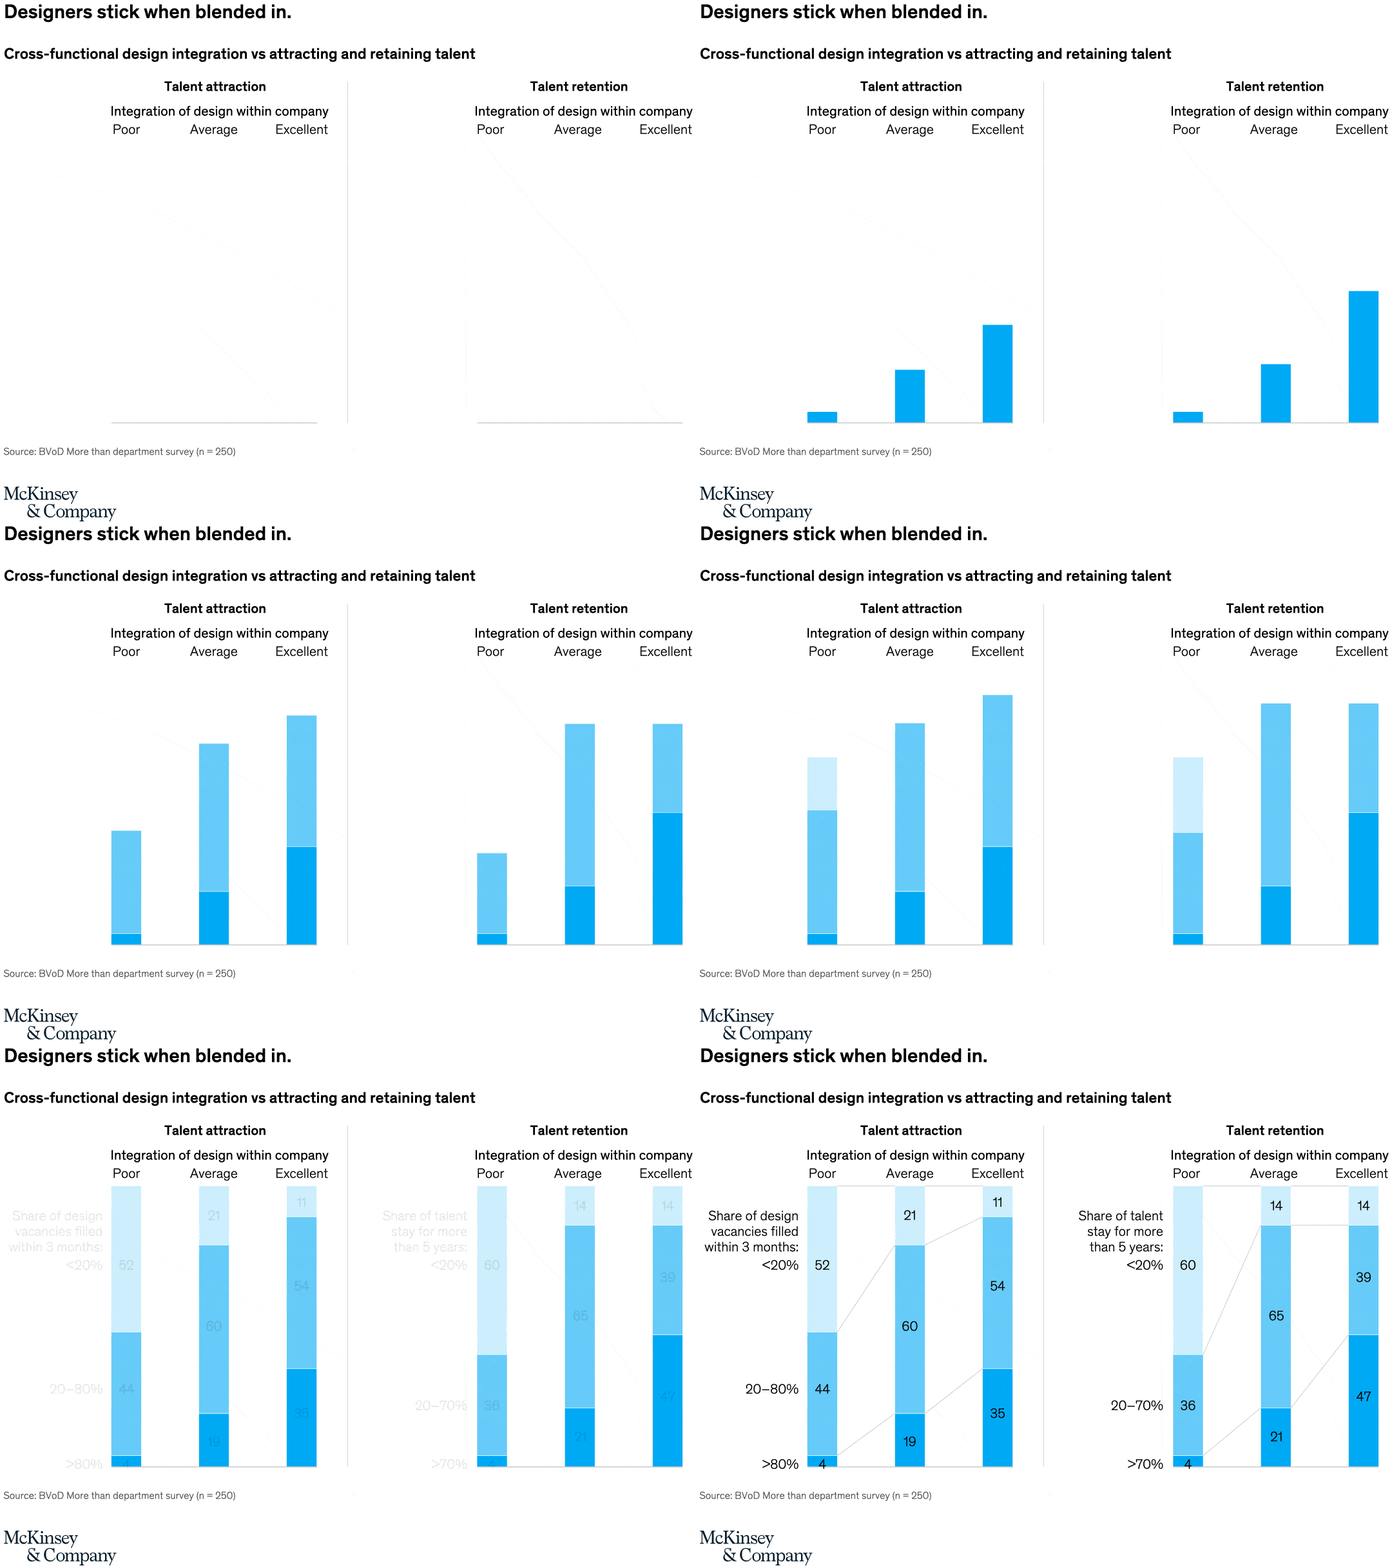
May 24, 2022 – Designers tend to stick around when they’re embedded in collaborative teams. Our research shows that cross-functional design integration often helps companies attract and retain design talent—an important consideration at a time when so many people are leaving their jobs in search of new opportunities.
To read the report, see “Redesigning the design department,” April 27, 2022.
customizer here
Visual form
Two-panel stacked column chart.
Layout / body structure
The chart places two aligned panels side by side: the left panel covers talent attraction and the right panel covers talent retention. Read the left panel first across poor, average, and excellent design integration, then move to the right panel and read the same three integration columns again.
What is being compared
The chart compares how companies with poor, average, and excellent cross-functional design integration are distributed across hiring and retention outcome bands. The left panel compares the share of design vacancies filled within three months, and the right panel compares the share of design talent that stays for more than five years.
Measurement system
The measurement is percent share of companies within each outcome band. Each vertical column totals 100 percent, and the stacked segments break that total into low, middle, and high performance brackets for the hiring panel and for the retention panel.
Visible structure inside the graphic
Each panel contains three vertical columns labeled poor, average, and excellent, and each column is internally split into three stacked bands. The repeated panel structure makes it easy to compare how the dark lower segments shrink and the taller upper segments grow as design integration improves.
Main takeaway from the visual
Better cross-functional design integration visibly shifts companies into stronger talent outcomes in both panels. The excellent-integration columns carry much more weight in the top performance bands, while the poor-integration columns are concentrated in the weakest bands for both vacancy filling and long-term retention.
Key standout values or extremes
In the talent-attraction panel, the share of companies filling fewer than 20 percent of vacancies within three months falls from 52 percent for poor integration to 11 percent for excellent integration, while the more-than-80-percent band rises from 4 percent to 35 percent. In the retention panel, the more-than-70-percent band rises from 4 percent for poor integration to 47 percent for excellent integration, while the below-20-percent band drops from 60 percent to 14 percent.
Controls / sequence, when applicable
This is a static chart image with no in-chart controls to operate.
Companion media, when applicable
There is no separate companion audio or video; the chart image is the full visual on this page.