Source page: McKinsey & Company
Commentary
Healthy people could lead to healthier economies
Healthcare | Economy
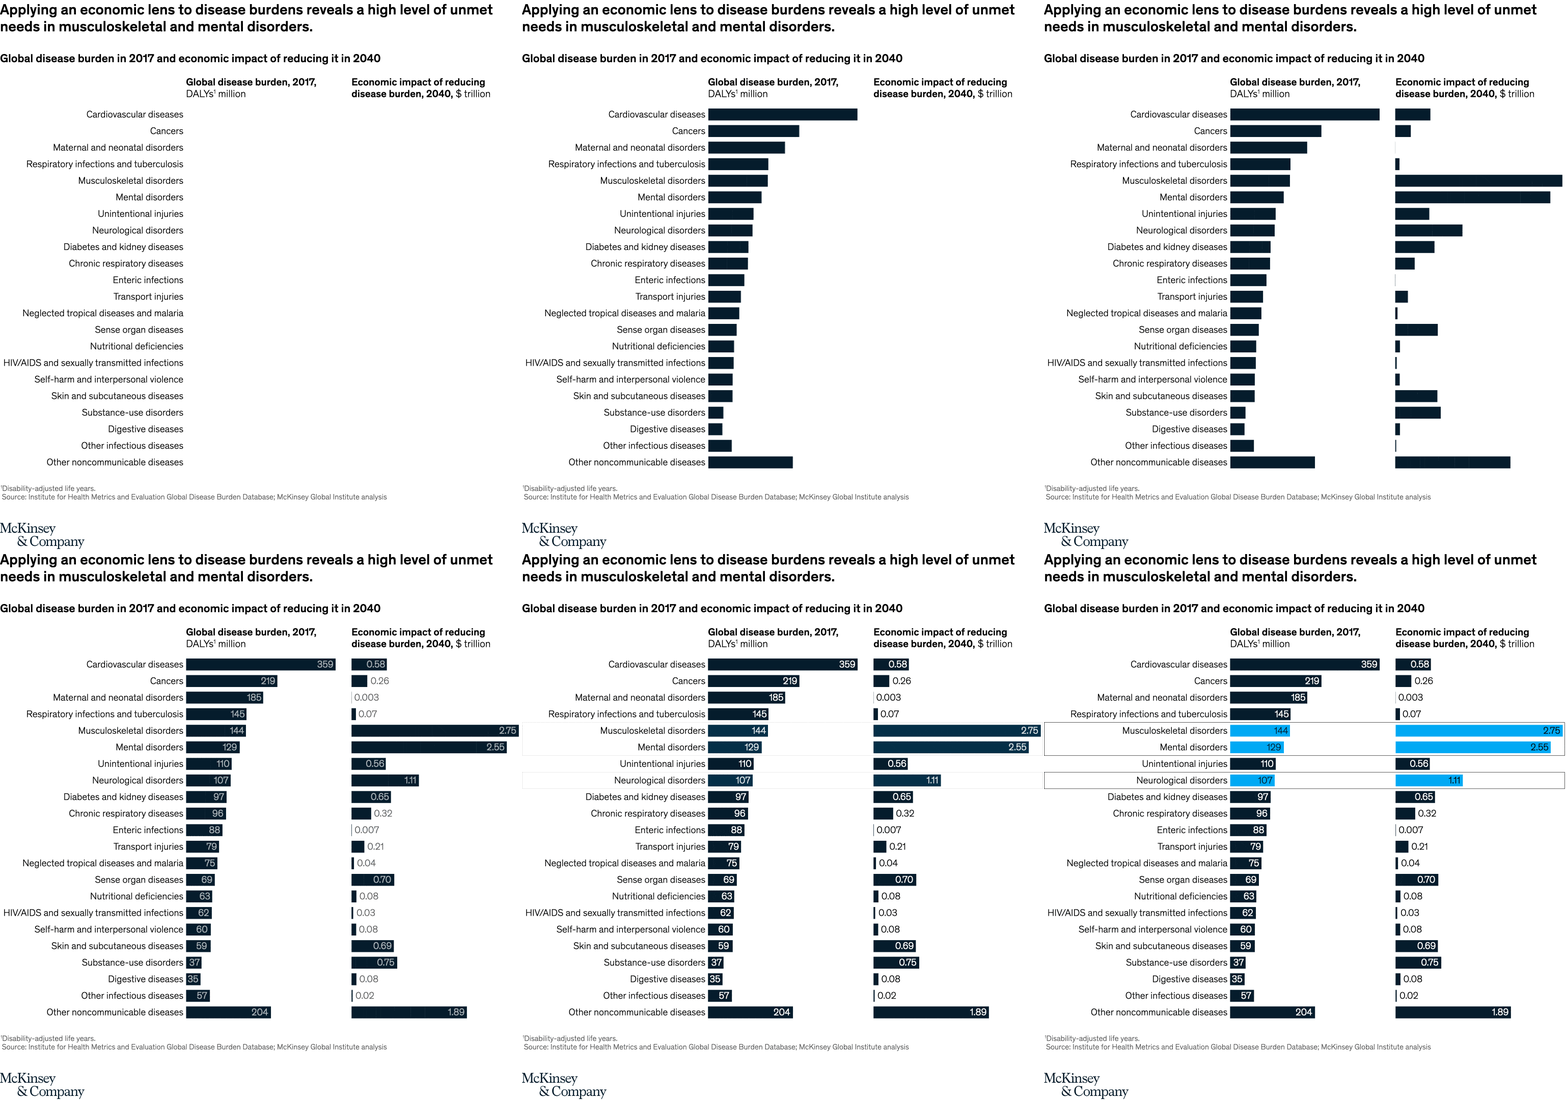
May 23, 2022 – When viewed from a societal perspective, musculoskeletal, mental-health, and neurological disorders combined drive the largest health burden. If the unmet needs of patients who suffer from these particular disorders are addressed, $13.4 trillion could be added to the global economy by 2040.
To read the article, see “Building pharma pipelines using a socioeconomic lens,” April 8, 2022.
customizer here
Visual form
Two-sided horizontal bar chart.
Layout / body structure
The chart is built on one long list of disease categories, with burden bars extending left and economic-impact bars extending right from the same central label column. Read a row across from left to right to compare the disease burden and the projected economic value for that condition before moving down to the next row.
What is being compared
The chart compares two dimensions for the same disease categories: global disease burden in 2017 and the economic impact of reducing that burden by 2040. It therefore pairs a health-burden ranking with a value-creation ranking on the same set of conditions.
Measurement system
The left side is measured in DALYs, or disability-adjusted life years, shown in millions, while the right side is measured in dollars of economic impact shown in trillions. Shared row labels connect the two scales, and highlighted blue bars call out the priority categories the page wants the reader to notice.
Visible structure inside the graphic
Dark bars populate both sides for the full disease list, while the highlighted categories are picked out in brighter blue so they stand apart from the rest of the ranking. The longest burden bars and the longest value bars sit on the same emphasized rows, which makes the dual-sided layout feel more like a mirrored comparison than two unrelated charts.
Main takeaway from the visual
Musculoskeletal disorders and mental disorders stand out because they combine a very large burden with a very large economic upside if that burden is reduced. The chart makes that relationship visible by showing those categories high in the left ranking and also far out on the right-side value scale.
Key standout values or extremes
Musculoskeletal disorders anchor the chart at 144 million DALYs on the left and about $2.75 trillion of economic impact on the right. Mental disorders follow at 129 million DALYs and about $2.56 trillion, while neurological disorders remain prominent at 107 million DALYs and about $1.11 trillion.
Controls / sequence, when applicable
This is a static chart image with no in-chart controls to operate.
Companion media, when applicable
There is no separate companion audio or video; the chart image is the full visual on this page.