Source page: McKinsey & Company
Commentary
Charging ahead
Automotive | Strategy
May 18, 2022 – The automotive industry’s focus on autonomous driving, connected cars, electric vehicles, and shared mobility (ACES) is prompting automotive suppliers to adapt. The McKinsey and the European Association of Automotive Suppliers survey revealed that 90 percent of suppliers said they were reshaping their portfolio mix to focus on technology-driven components while de-emphasizing hardware.
To read the article, see “Amid disruption, automotive suppliers must reimagine their footprints,” April 19, 2022.
customizer here
Visual form
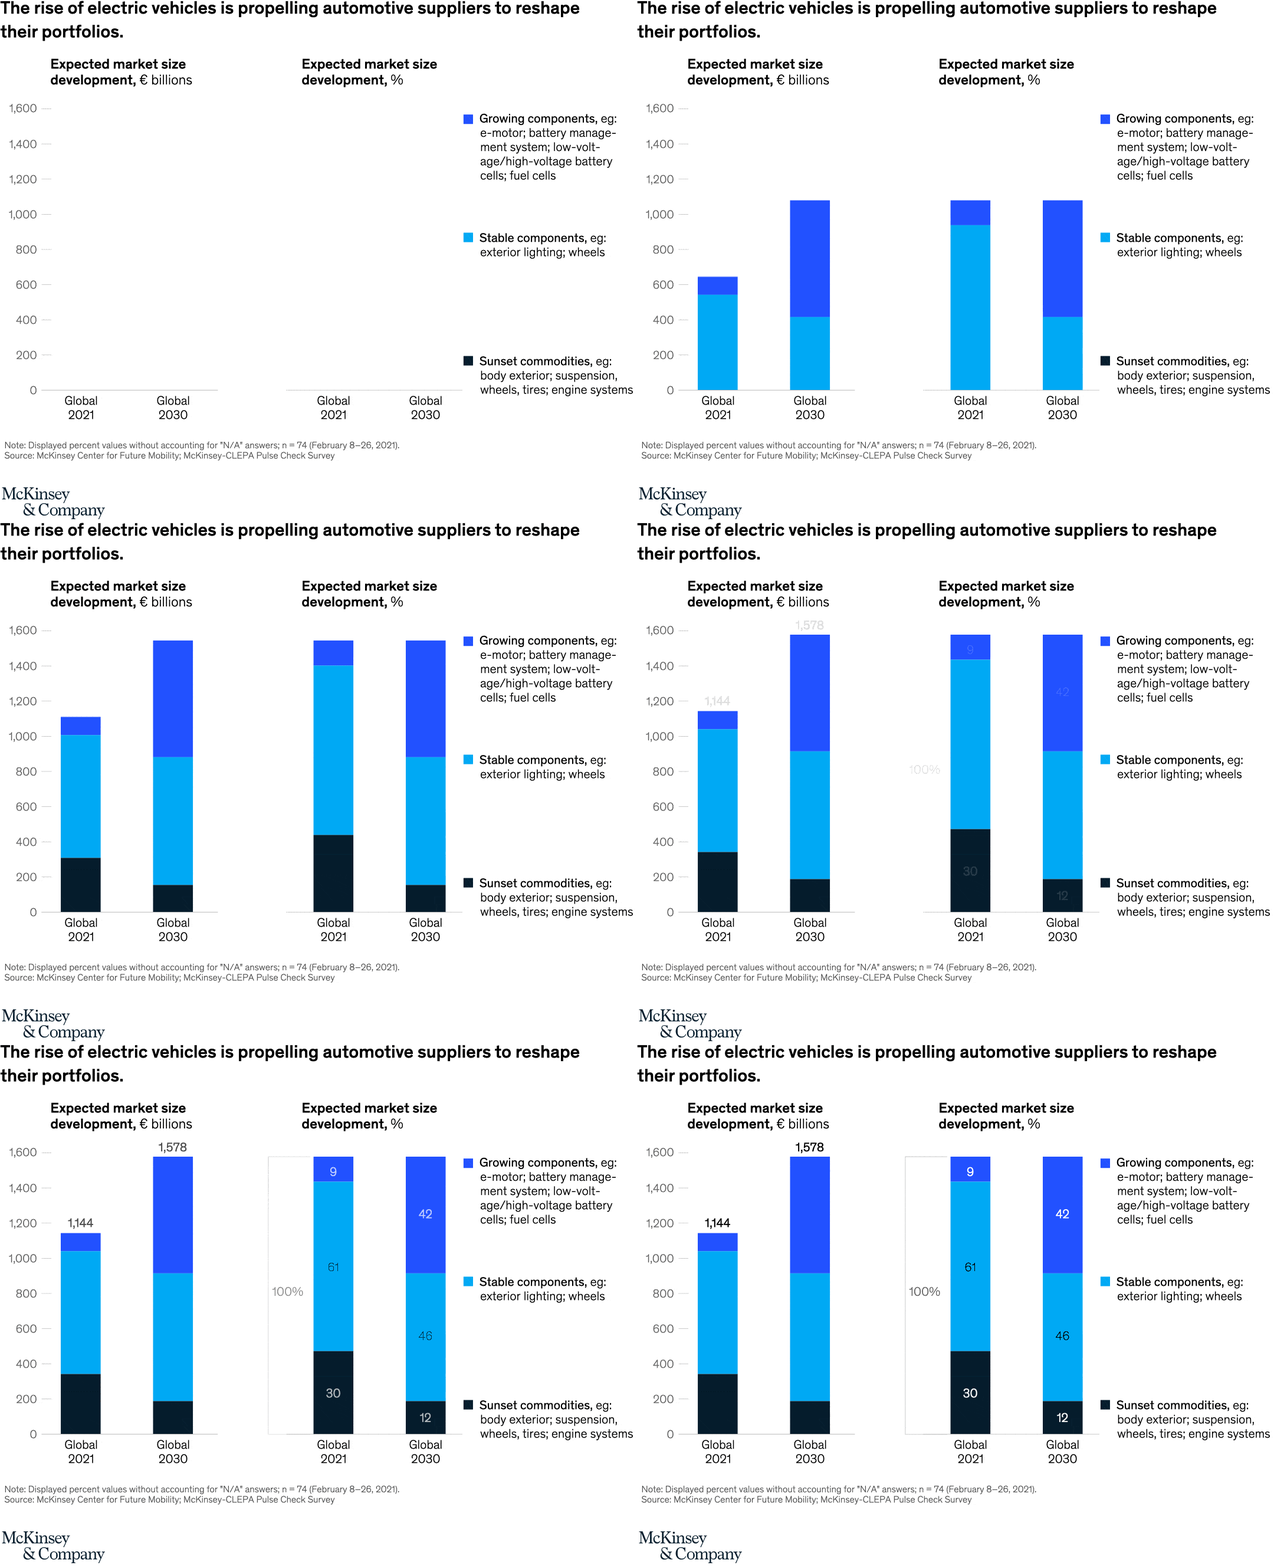
Two-panel stacked column chart.
Layout / body structure
The chart places two panels side by side. Read the left panel first for expected market size in euros, then move to the right panel for the same portfolio split expressed as percentages in 2021 and 2030.
What is being compared
The chart compares automotive supplier portfolio mix across three component groups: sunset commodities, stable components, and growing components. It compares those groups both by total market size and by share of the overall portfolio, with a 2021-versus-2030 time comparison in each panel.
Measurement system
The left panel is measured in euros billions, and the right panel is measured as percentage share out of 100. The dark segment marks sunset commodities, the middle blue segment marks stable components, and the brighter blue top segment marks growing components tied to electric-vehicle systems.
Visible structure inside the graphic
Each panel contains two stacked columns, one for global 2021 and one for global 2030, using the same three-color stack order. A legend on the right names the three component groups, and the repeated stack pattern lets the reader compare both absolute expansion and mix shift at the same time.
Main takeaway from the visual
The picture shows a portfolio rotation away from sunset commodities and toward growing EV-related components as the overall market expands. Stable components remain a large middle block in both years, but the most dramatic visual change is the growth segment swelling from a small cap in 2021 to a much larger top block in 2030.
Key standout values or extremes
Total expected market size rises from EUR 1,144 billion in 2021 to EUR 1,578 billion in 2030. In the share panel, sunset commodities fall from 30 percent to 12 percent, stable components fall from 61 percent to 46 percent, and growing components jump from 9 percent to 42 percent.
Controls / sequence, when applicable
This is a static chart image with no in-chart controls to operate.
Companion media, when applicable
There is no separate companion audio or video; the chart image is the full visual on this page.