Source page: McKinsey & Company
Commentary
Make way for new players
Pharmaceuticals & Medical Products
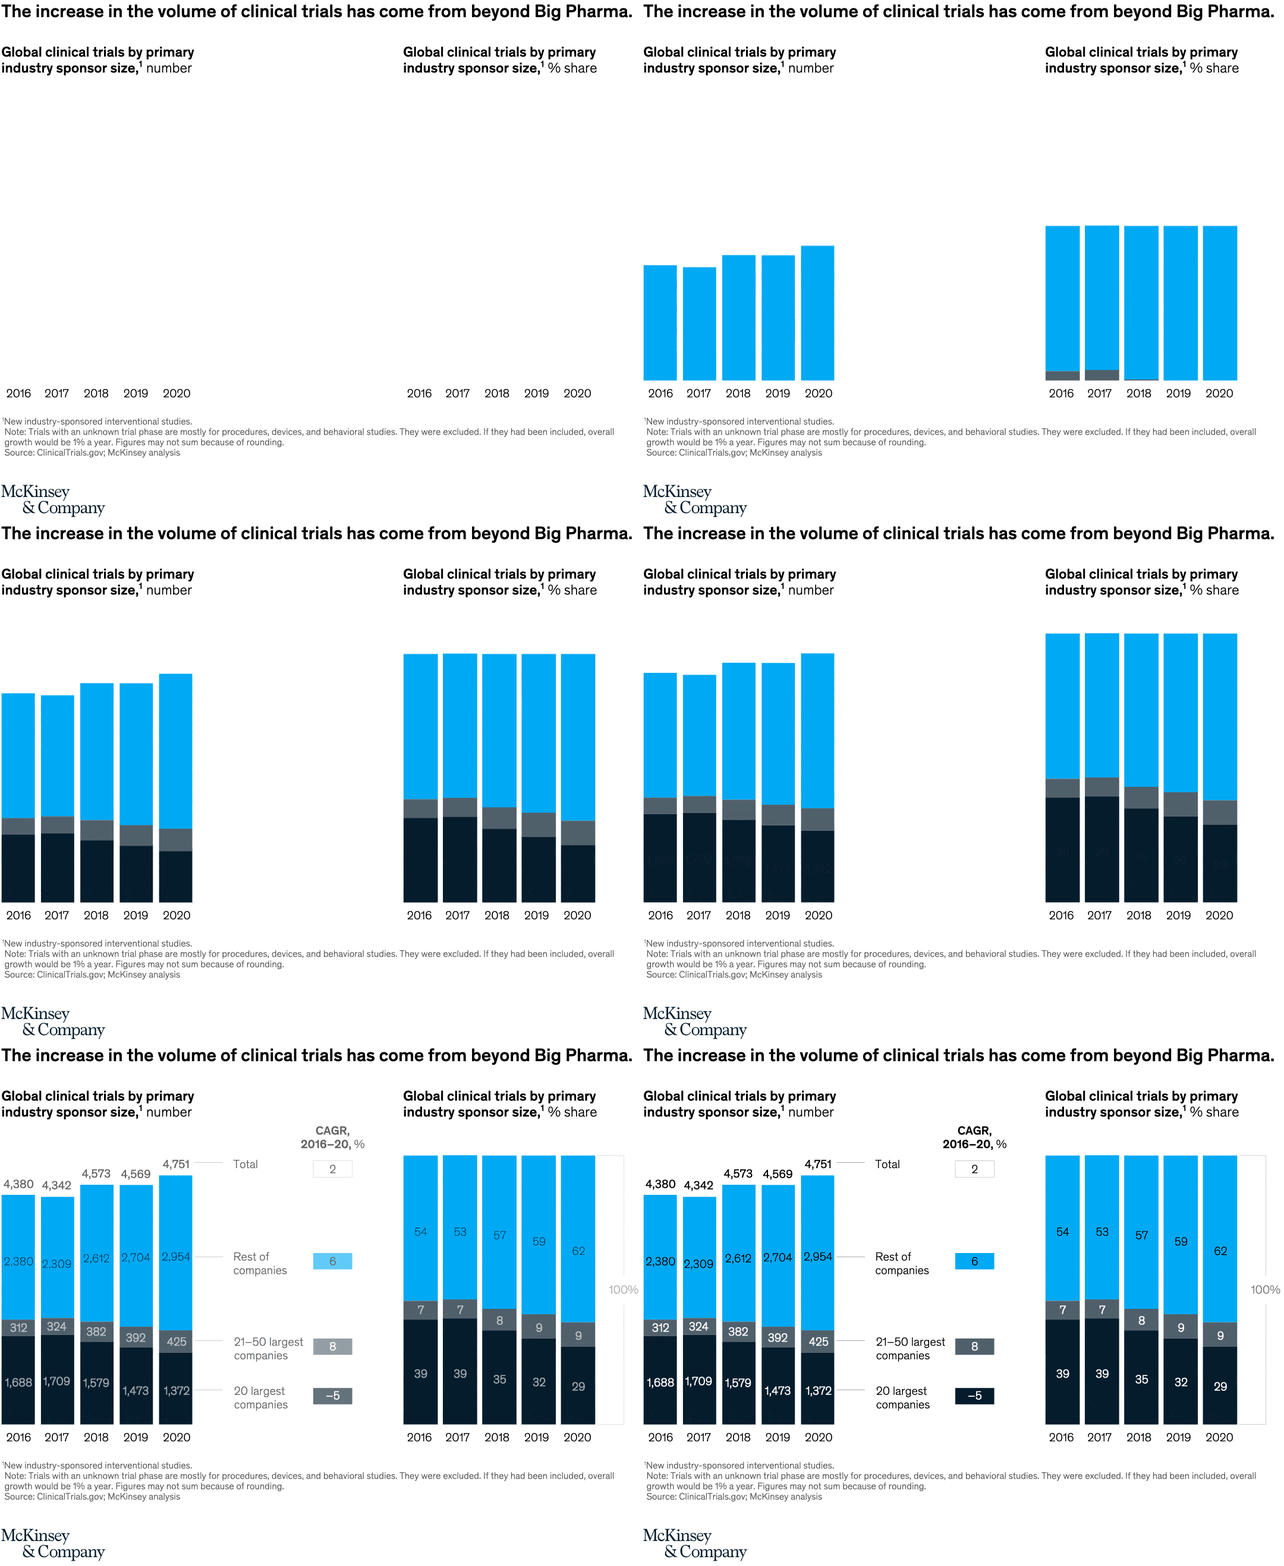
May 17, 2022 – In 2020, some 70 percent of new clinical trials were sponsored by smaller pharma companies, up from 60 percent in 2016. Unprecedented levels of venture-capital investment and increasing availability and breadth of outsourced capacity and capabilities paved the way for smaller companies to pursue innovation.
To read the article, see “Building pharma pipelines using a socioeconomic lens,” April 8, 2022.
customizer here
Visual form
Two-panel stacked column time-series chart with a CAGR callout.
Layout / body structure
The chart is arranged in three vertical zones: counts on the left, CAGR callouts in the middle, and share by sponsor size on the right. Read the five yearly stacked columns on the left first, then the CAGR strip, and then the five yearly share columns on the right.
What is being compared
The chart compares global clinical trials by primary industry sponsor size across three sponsor groups: the 20 largest companies, the 21st through 50th largest companies, and the rest of companies. It compares those groups both by raw number of trials and by percentage share from 2016 through 2020.
Measurement system
The left panel is measured as the number of global clinical trials, while the right panel is measured as percent share out of 100. The center strip reports CAGR for 2016 to 2020 for the total market and for each sponsor-size group.
Visible structure inside the graphic
Five stacked columns on the left show the annual totals and how the three sponsor tiers contribute to each year, while five matching share columns on the right show the same split on a 100 percent basis. The center CAGR labels act like a bridge between the two panels, telling the reader which sponsor bands are growing fastest without adding another full chart.
Main takeaway from the visual
The growth in clinical trials is visibly coming from beyond the largest pharmaceutical companies. The bright-blue segment for the rest of companies grows year by year in both the count panel and the share panel, while the dark segment for the 20 largest companies shrinks as a portion of the whole.
Key standout values or extremes
Total global clinical trials rise from 4,380 in 2016 to 4,751 in 2020. The rest-of-companies segment grows from 2,380 trials and 54 percent share to 2,954 trials and 62 percent share, while the 20 largest companies fall from 1,688 trials and 39 percent share to 1,372 trials and 29 percent share; the CAGR strip shows 6 percent for the rest of companies, 8 percent for ranks 21 to 50, and negative 5 percent for the 20 largest.
Controls / sequence, when applicable
This is a static chart image with no in-chart controls to operate.
Companion media, when applicable
There is no separate companion audio or video; the chart image is the full visual on this page.