Source page: McKinsey & Company
Commentary
Waste not, want not
Retail | Sustainability
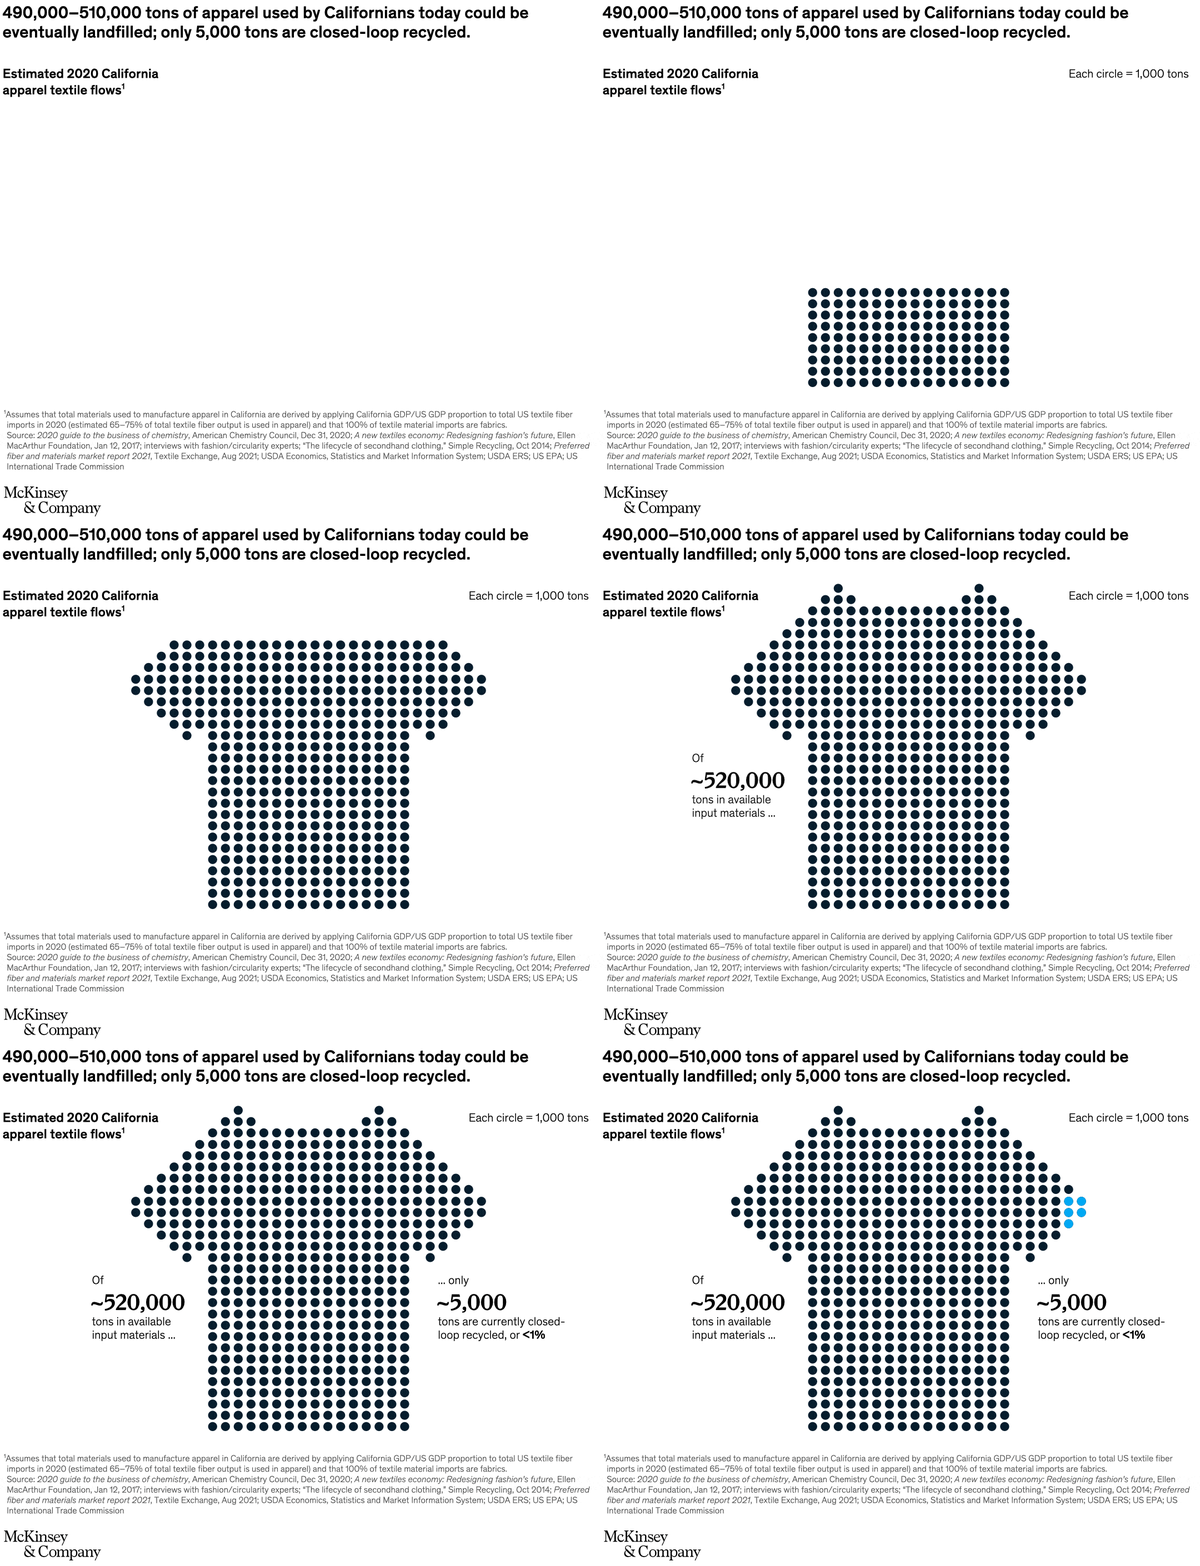
May 2, 2022 – California has a clothing conundrum. In 2020, residents of the “Golden State” bought and wore up to 530,000 tons of clothing, and some 500,000 of those tons will eventually enter landfills. Less than 1 percent of the materials worn today will resurface in clothing manufactured tomorrow.
To read the article, see “Closing the loop: Increasing fashion circularity in California,” March 31, 2022.
customizer here
Visual form
Dot-matrix infographic shaped like a T-shirt.
Layout / body structure
The display centers one large shirt silhouette made out of dots, with the headline and unit note above it and callouts on the left and right. Read the full shirt shape first as the total material flow, then compare the small blue subset on the right against the much larger field of dark dots.
What is being compared
The graphic compares the total volume of apparel textile material used in California with the much smaller amount that is currently recycled back into closed-loop use. It is a whole-versus-recycled comparison rather than a time trend.
Measurement system
Each dot represents 1,000 tons. The full shirt is built from hundreds of dots to represent the approximate 520,000 tons of available input materials, and the highlighted blue dots isolate the roughly 5,000 tons that are currently closed-loop recycled.
Visible structure inside the graphic
Most of the shirt is filled with dark navy circles, while only a tiny cluster at the far right sleeve edge turns blue. The left callout labels the total material pool, and the right callout explains that the highlighted subset is the currently recycled share, so the entire message is carried by the contrast between the dense shirt body and the tiny colored remainder.
Main takeaway from the visual
The chart makes the recycling gap look extreme: almost the entire shirt remains in the unrecycled pool, and only a sliver of the total flow is recaptured in a closed loop. The blue highlight is so small relative to the full shape that the shortfall reads immediately without needing a second chart.
Key standout values or extremes
The page anchors the total at roughly 490,000 to 510,000 tons used by Californians and about 520,000 tons of available input materials, while only about 5,000 tons are currently closed-loop recycled. Because each circle equals 1,000 tons, the blue cluster amounts to only a handful of dots and is labeled as less than 1 percent of the total.
Controls / sequence, when applicable
This is a static chart image with no in-chart controls to operate.
Companion media, when applicable
There is no separate companion audio or video; the chart image is the full visual on this page.