Source page: McKinsey & Company
Commentary
Lost time
COVID-19 | Education
April 26, 2022 – The pandemic has disrupted student learning, with meaningful disparities across and within regions. Students in South Asia, Latin America, and the Caribbean, for example, may be more than a year behind, whereas students in North America and Europe might be an average of four months behind. Our article explores how school systems can respond.
To read the article, see “How COVID-19 caused a global learning crisis,” April 4, 2022.
customizer here
Visual form
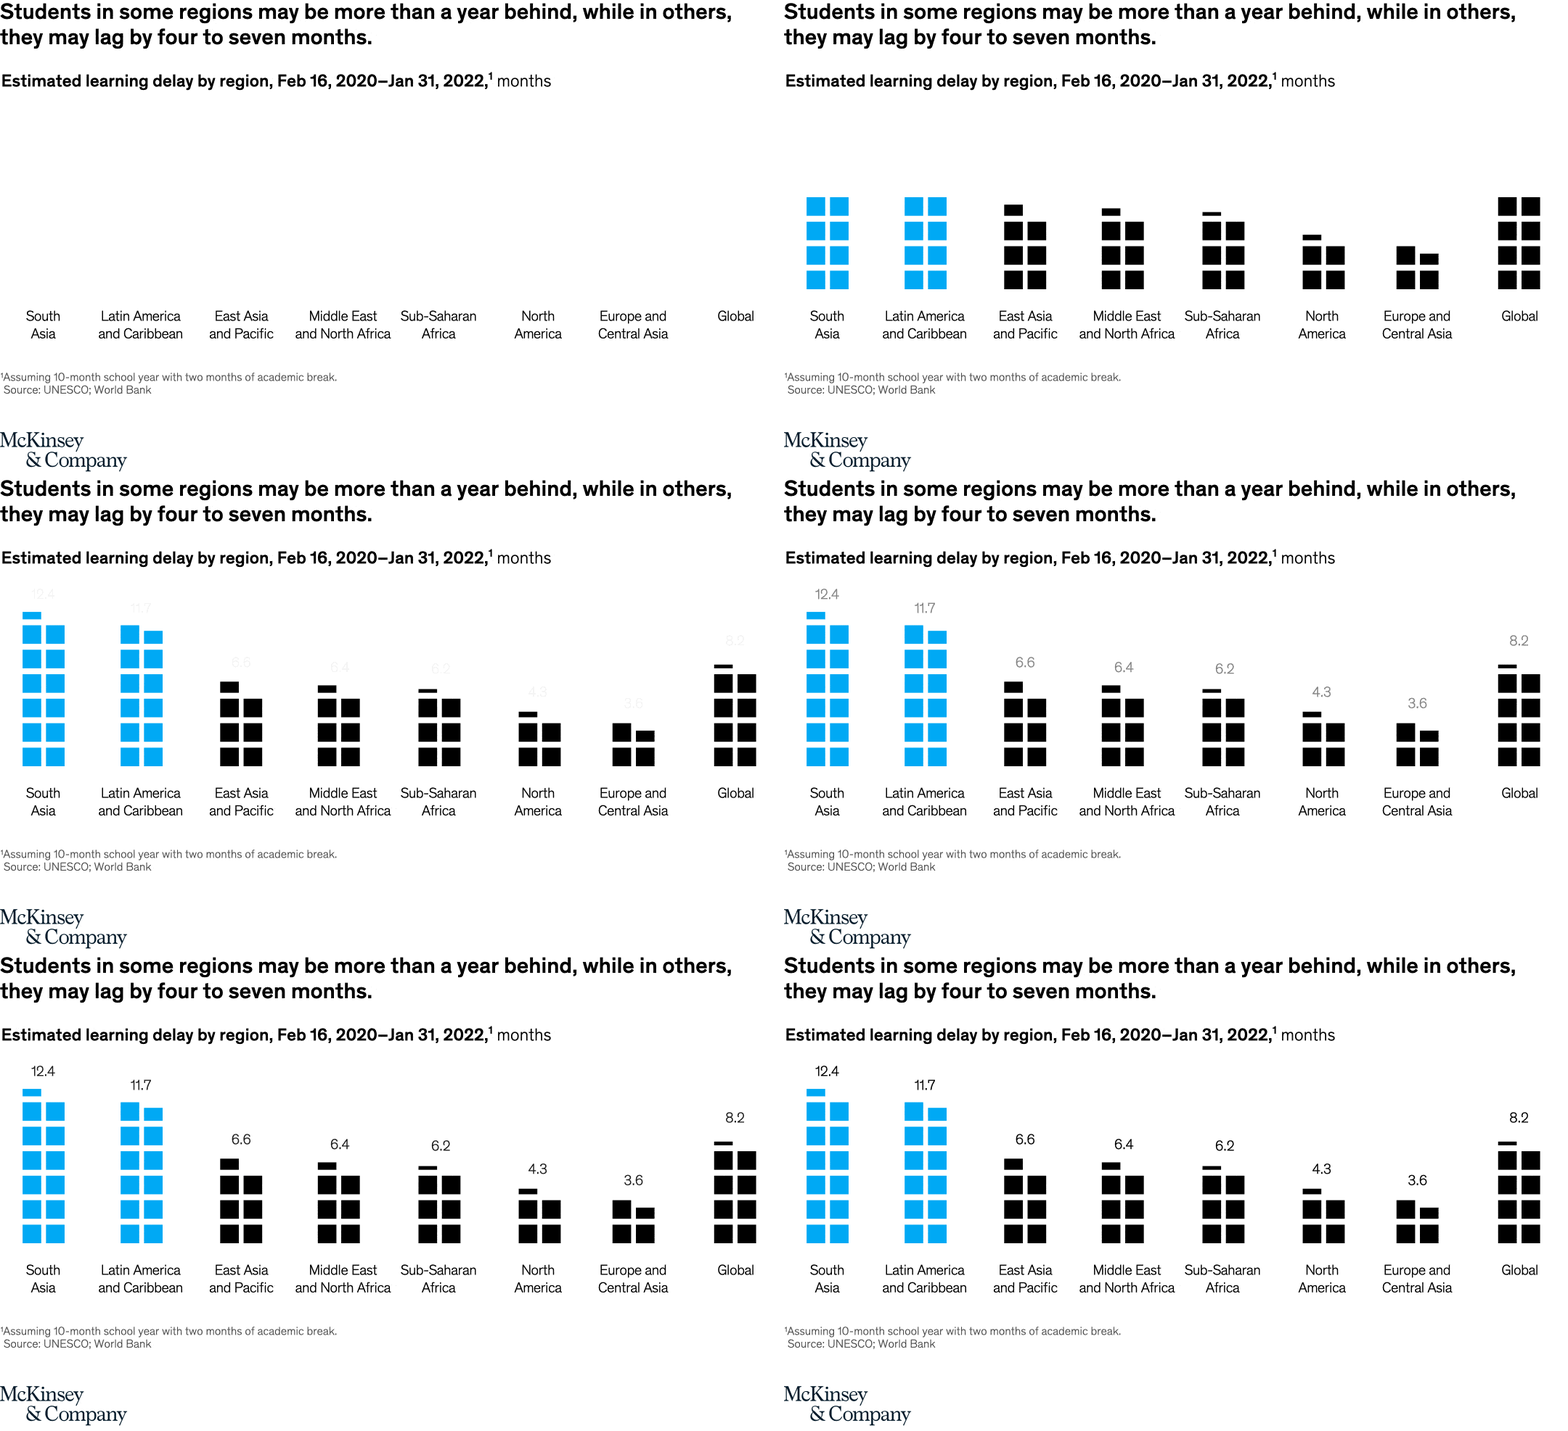
Regional pictogram comparison chart.
Layout / body structure
The chart is a single horizontal row of regional icon stacks. Read left to right across the regions, using the numeric label above each stack and the number of filled tiles below it together to compare the estimated learning delay.
What is being compared
The chart compares estimated learning delay across regions from February 16, 2020 to January 31, 2022. It places South Asia, Latin America and the Caribbean, East Asia and Pacific, Middle East and North Africa, Sub-Saharan Africa, North America, Europe and Central Asia, and the global figure on one shared page.
Measurement system
The primary measure is months of learning delay, printed directly above each regional icon stack. The square tiles act as visual proxies for those month values, so taller stacks signal larger delays even though the exact values come from the labels rather than from an axis.
Visible structure inside the graphic
Each region is represented by a compact grid of square blocks with a number floating above it and a region label below. The two blue stacks at the left are visibly taller than the rest, while the middle and right sections compress into shorter black stacks, making the ranking readable at a glance.
Main takeaway from the visual
Learning loss is global, but the scale differs sharply by region. South Asia and Latin America and the Caribbean stand well above the rest at roughly a year of delay, while Europe and Central Asia and North America sit at the shorter end of the page.
Key standout values or extremes
South Asia is highest at 12.4 months and Latin America and the Caribbean follows at 11.7 months. Europe and Central Asia is lowest at 3.6 months, North America is 4.3 months, East Asia and Pacific is 6.6 months, Middle East and North Africa is 6.4 months, Sub-Saharan Africa is 6.2 months, and the global figure is 8.2 months.
Controls / sequence, when applicable
This is a static chart image with no in-chart controls to operate.
Companion media, when applicable
There is no separate companion audio or video; the chart image is the full visual on this page.