Source page: McKinsey & Company
Commentary
Experiencing some turbulence
Travel & Transportation
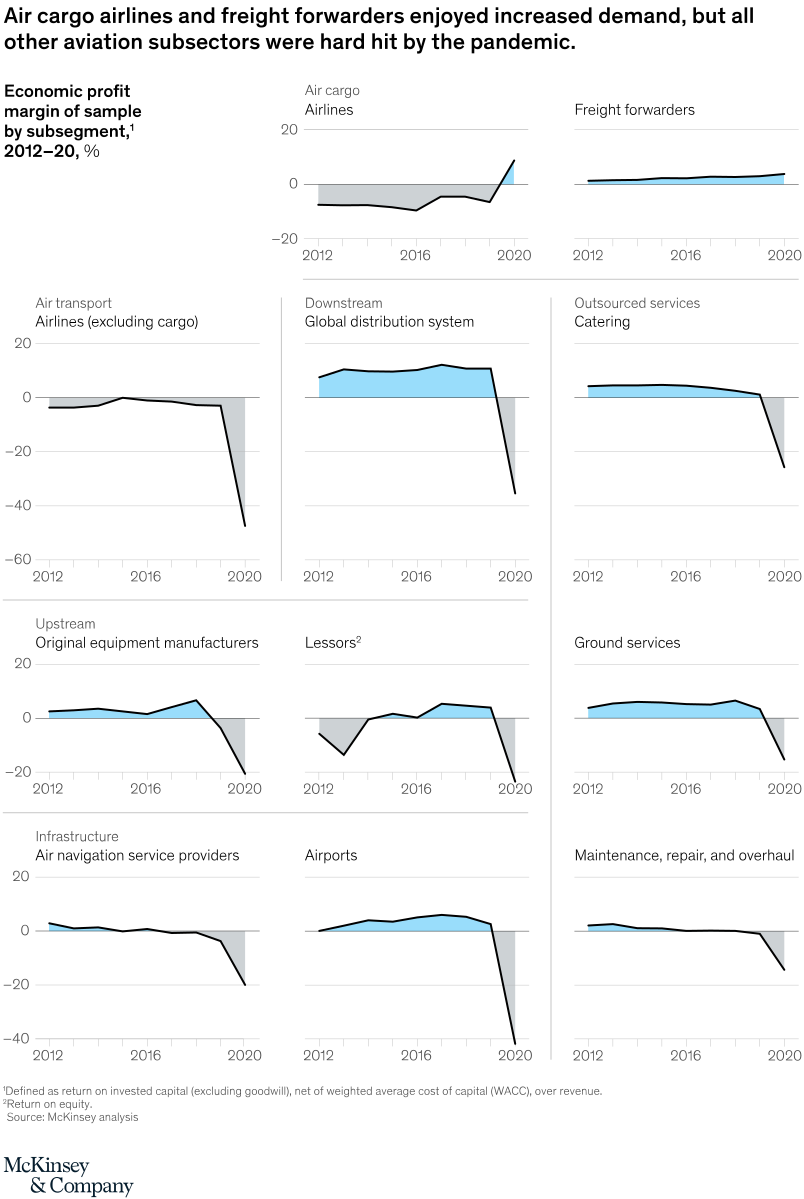
April 19, 2022 – The pandemic has been tough on the aviation industry. In 2020, most subsectors—including airports, original-equipment manufacturers (OEMs) of aircraft, and catering operations—reported massive losses. The exceptions: freight forwarders and cargo airlines, which benefited from a rise in demand for air cargo.
To read the article, see “Taking stock of the pandemic’s impact on global aviation,” March 31, 2022.
customizer here
Visual form
Small-multiples line-chart dashboard.
Layout / body structure
The chart is a grid of aviation subsectors, each with its own short time-series line from 2012 to 2020 on a shared profit-margin scale. Read panel by panel from the top-left across each row, because the format repeats the same metric for airlines, freight forwarders, distribution systems, catering, manufacturers, lessors, airports, and other subsectors.
What is being compared
The dashboard compares economic profit margin across different aviation subsectors over time. It contrasts cargo-related winners such as air cargo airlines and freight forwarders with passenger-airline and service-heavy businesses that were pushed sharply downward by the pandemic shock.
Measurement system
Every panel uses economic profit margin as a percentage on the vertical axis and years from 2012 through 2020 on the horizontal axis. The shared scales make it possible to compare which subsectors stayed near break-even, which were modestly profitable, and which collapsed furthest below zero in 2020.
Visible structure inside the graphic
Each mini-chart uses the same black line with a blue underfill above zero and gray underfill below zero, so profit and loss regions are visually separated in the same way across the grid. The common baseline and repeated panel format make the 2020 drop easy to compare across all subsectors without relying on one crowded combined chart.
Main takeaway from the visual
Cargo-related businesses are the clear exceptions in a field of pandemic damage. Air cargo airlines and freight forwarders stay positive and even strengthen at the right edge, while airlines excluding cargo, global distribution systems, airports, and several service providers fall sharply below zero in the final year.
Key standout values or extremes
Freight forwarders remain modestly positive throughout the series and air cargo airlines jump up to a visibly positive endpoint in 2020. By contrast, airlines excluding cargo drop to roughly minus 50 percent at the far right, global distribution systems fall to the mid-minus-30s, airports fall to the low-minus-40s, catering falls to roughly minus 25, and lessors fall below minus 20.
Controls / sequence, when applicable
This is a static chart image with no in-chart controls to operate.
Companion media, when applicable
There is no separate companion audio or video; the chart image is the full visual on this page.