Source page: McKinsey & Company
Commentary
Innovation ain’t easy
Innovation | Analytics
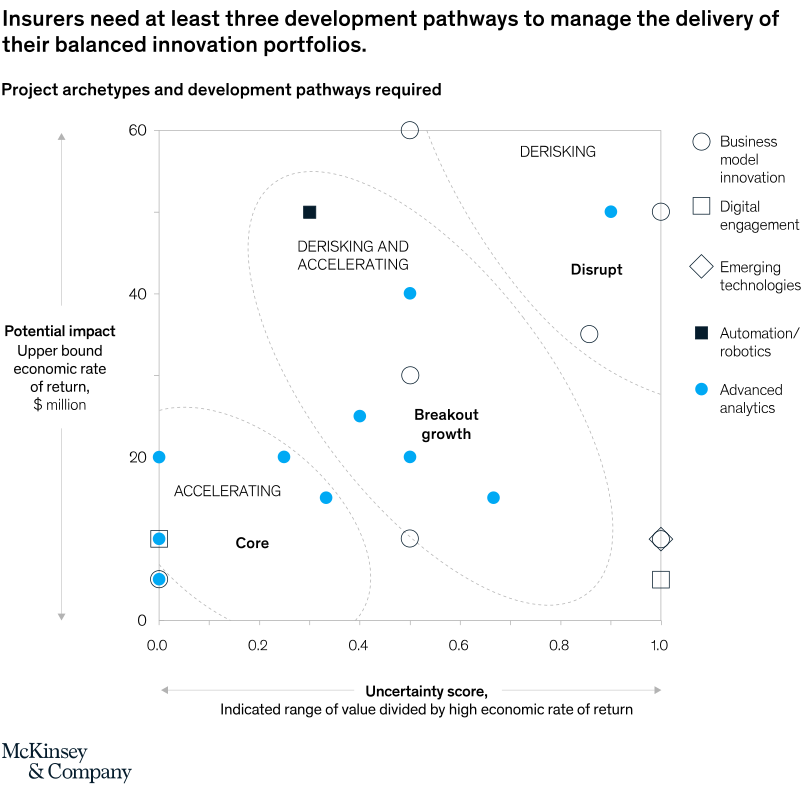
April 8, 2022 – The insurance industry has a lot to gain through innovation, and C-suite leaders ranked it as one of their top two priorities in a 2020 survey. But delivering sustainable growth through innovation doesn’t come easily. Maintaining a balanced innovation portfolio involves distinct pathways for product development—derisking, accelerating, and derisking and accelerating—each resulting in different potential rates of return.
To read the article, see “Five steps to improve innovation in the insurance industry,” March 4, 2022.
customizer here
Visual form
Categorized scatter plot.
Layout / body structure
The chart is one scatter plot with a horizontal uncertainty scale and a vertical potential-impact scale, plus a shape-and-color legend on the right. Read the point field from lower left to upper right first, then use the dotted boundary zones and the legend to see how the project archetypes cluster into core, accelerating, breakout growth, derisking and accelerating, derisking, and disrupt groups.
What is being compared
The chart compares insurance project archetypes by two dimensions at once: uncertainty score and upper-bound economic potential. It also compares different innovation types, including business model innovation, digital engagement, emerging technologies, automation and robotics, and advanced analytics.
Measurement system
The horizontal axis runs from 0.0 to 1.0 as an uncertainty score, while the vertical axis is a potential-impact measure in millions of dollars. Shapes identify innovation types and colored fills distinguish categories such as advanced analytics and automation, so the reader is tracking both coordinates and point identity at the same time.
Visible structure inside the graphic
The page uses open circles, squares, diamonds, solid dark squares, and blue dots spread across several dotted zones. Low-uncertainty points cluster in the core and accelerating area toward the left, while the higher-uncertainty points gather in breakout growth, derisking, and disrupt zones toward the center-right and upper-right of the plot.
Main takeaway from the visual
Balanced innovation portfolios need multiple development pathways because the opportunities are spread across very different combinations of uncertainty and impact. The plot makes that visible by separating mature low-uncertainty work on the left from higher-upside but less certain opportunities in the breakout, derisking, and disrupt regions farther right.
Key standout values or extremes
The highest plotted impact sits around 60 on the vertical scale near the midpoint of the uncertainty axis, while other large opportunities appear near 50 at much higher uncertainty toward the right edge. Several low-uncertainty points sit near 0.0 to 0.1 on the horizontal axis with impact levels in the single digits to low 20s, showing how the portfolio spans both safer low-upside and riskier high-upside options.
Controls / sequence, when applicable
This is a static chart image with no in-chart controls to operate.
Companion media, when applicable
There is no separate companion audio or video; the chart image is the full visual on this page.