Source page: McKinsey & Company
Commentary
An app a day?
Digital | Healthcare | Europe
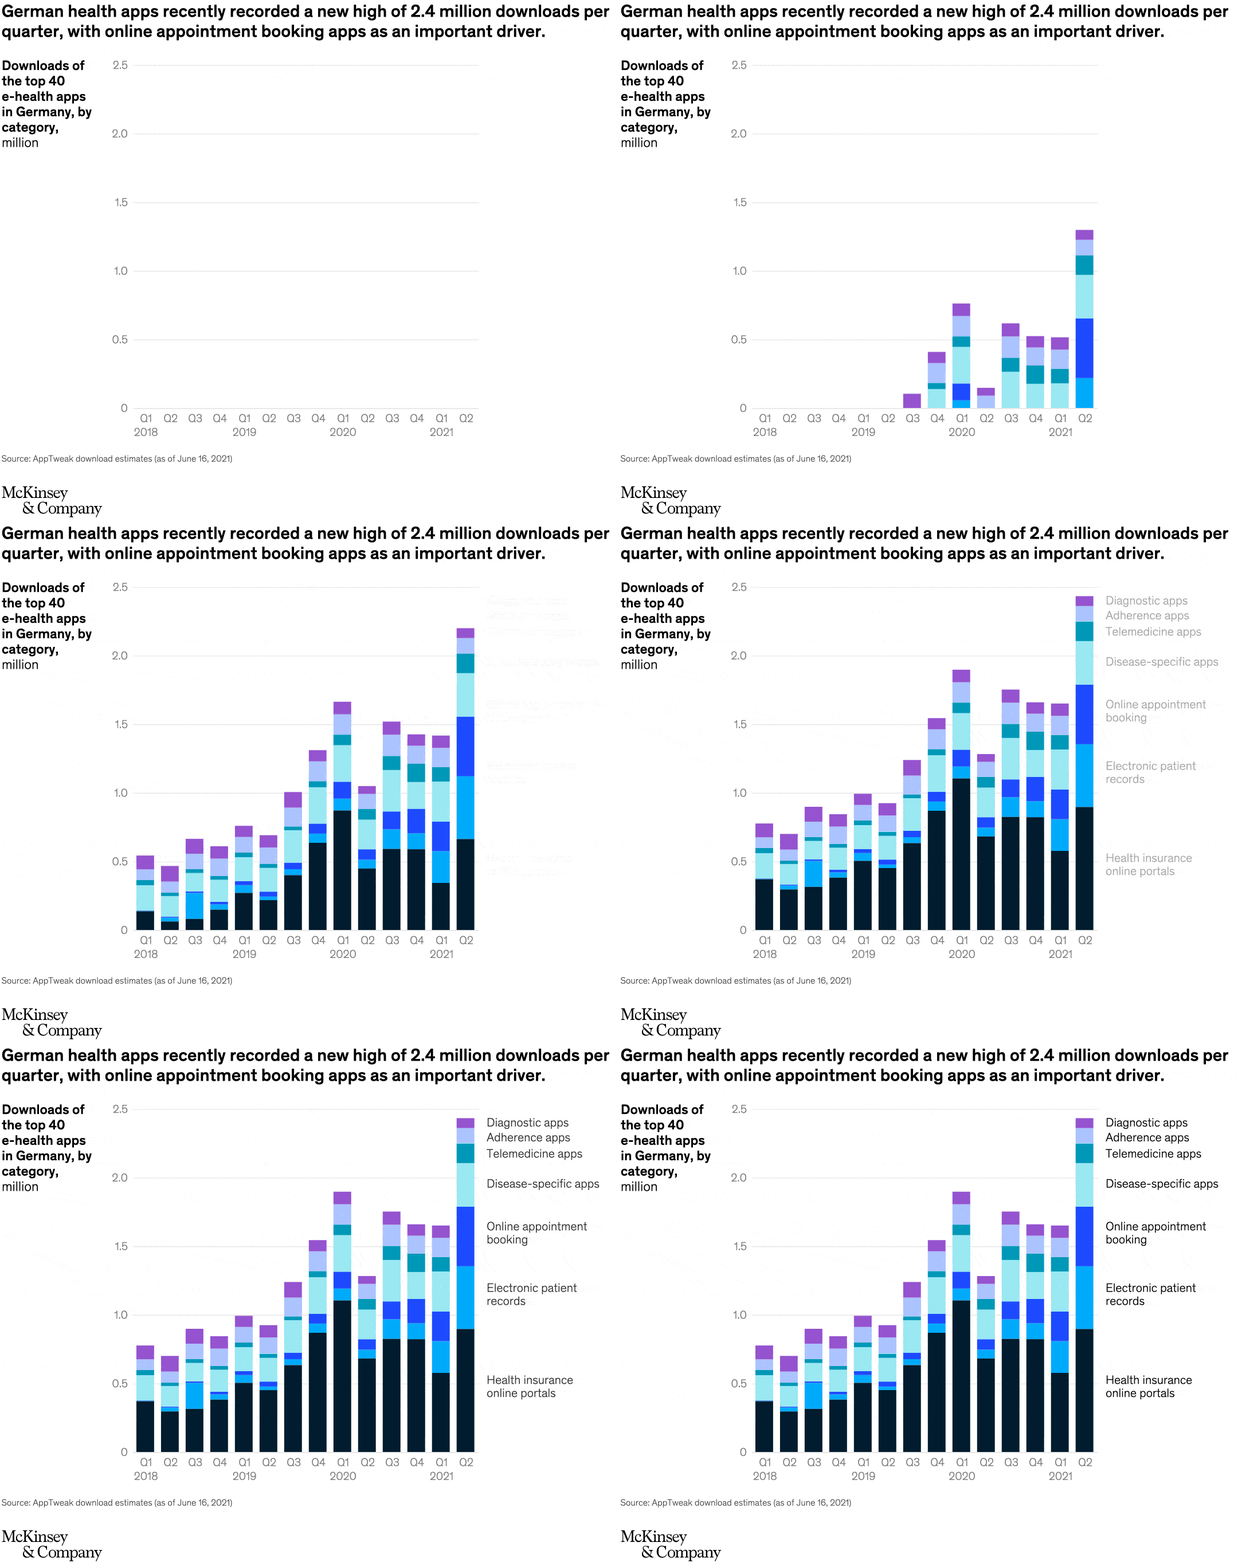
April 6, 2022 – In Germany, health apps have taken off during the pandemic. Between the fall of 2019 and the summer of 2021, for example, the number of downloads of the top 40 e-health apps doubled to 2.4 million, with online appointment booking as one of the most popular categories.
To read the article, see “Germany’s e-health transformation makes uneven progress,” March 15, 2022.
customizer here
Visual form
Stacked-column time-series chart.
Layout / body structure
The chart is a single run of quarterly stacked columns from 2018 through 2021. Read left to right across the quarters, using the total bar height to track overall downloads and the internal colored bands to see which app categories make up that volume.
What is being compared
The chart compares downloads of the top 40 e-health apps in Germany across quarters and across app categories. The categories include health insurance portals, electronic patient records, online appointment booking, disease-specific apps, telemedicine apps, adherence apps, and diagnostic apps.
Measurement system
The vertical axis is downloads in millions per quarter. Each quarterly column is stacked by app category, so the reader sees both the total quarterly download level and the category mix inside that total.
Visible structure inside the graphic
The bars climb gradually through 2019, jump higher in 2020, and peak at the far right in 2021. The darkest base band remains a large component across the series, while the lighter upper slices widen over time, making the later columns look both taller overall and more diversified in their category composition.
Main takeaway from the visual
German e-health app downloads accelerated sharply, reaching a new high by the end of the sequence. The rightmost bars stand noticeably above the earlier quarters, which makes the growth in demand for digital health tools look persistent rather than temporary.
Key standout values or extremes
The headline anchors the peak at 2.4 million downloads per quarter. Early 2018 bars sit well below 1.0 million, while the 2020 and 2021 bars move up into roughly the 1.5 to 2.4 million range, with the tallest column at the far right marking the series high.
Controls / sequence, when applicable
This is a static chart image with no in-chart controls to operate.
Companion media, when applicable
There is no separate companion audio or video; the chart image is the full visual on this page.