Source page: McKinsey & Company
Commentary
Arrivals and departures
Organization | Talent
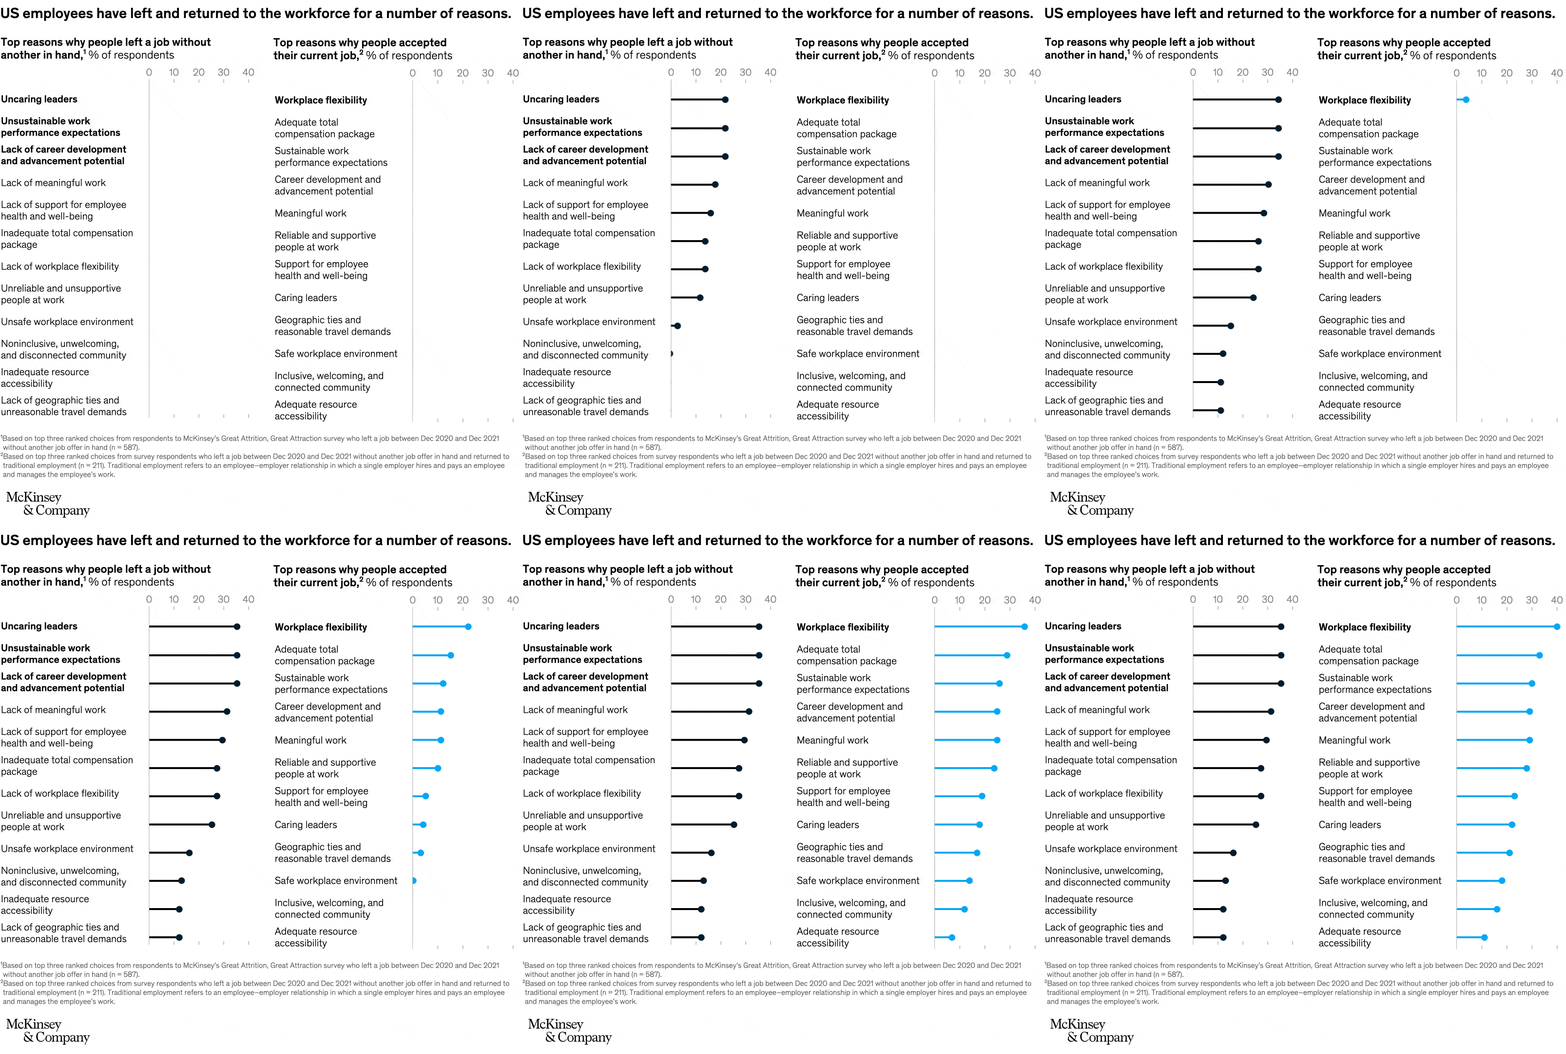
April 4, 2022 – Workers are on the move, for a number of reasons. Uncaring leaders, unsustainable expectations of work performance, and lack of career advancement are the top three reasons workers quit their jobs. And for those who returned to traditional employment, these workers were primarily lured back by workplace flexibility, with adequate compensation as a secondary reason.
To read the article, see “Gone for now, or gone for good? How to play the new talent game and win back workers,” March 9, 2022.
customizer here
Visual form
Two-panel horizontal lollipop comparison chart.
Layout / body structure
The chart is split into two ranked panels placed side by side on the same page. The left panel lists reasons people left a job without another one in hand, and the right panel lists reasons people accepted their current job, so the reader scans down the left ranking first and then down the right ranking on the same 0 to 40 percent scale.
What is being compared
The chart compares two different decision moments in the labor market: the reasons respondents quit and the reasons respondents returned to traditional employment. Within each panel, it also compares a full set of workplace factors such as leadership, workload expectations, career development, flexibility, compensation, safety, community, and travel demands.
Measurement system
Both panels measure percent of respondents, using a horizontal axis labeled from 0 to 40. Each row ends in a dot placed at the relevant percentage, so the reader is tracking rank order and the approximate spread between reasons rather than stacked totals or cumulative shares.
Visible structure inside the graphic
Each row starts at a central baseline and extends as a thin horizontal line to a round dot marker. The left panel uses dark markers for quitting reasons, the right panel uses bright blue markers for accepting reasons, and the category labels sit outside the plot area so the page reads like two parallel ranked reason lists.
Main takeaway from the visual
The page shows that people most often left because of leadership and work-design problems, while they most often came back for flexibility and a better overall employment package. The contrast between the left and right panels makes the labor market look less like a single pay story and more like a mismatch between poor workplace conditions and more attractive job design.
Key standout values or extremes
On the quitting side, uncaring leaders, unsustainable work-performance expectations, and lack of career development and advancement potential all sit near the mid-30-percent range and lead the panel. On the return side, workplace flexibility reaches about 40 percent, adequate total compensation lands in the mid-30s, and sustainable expectations plus career development cluster around 30 percent, while the lowest rows in both panels sit closer to the low teens.
Controls / sequence, when applicable
This is a static chart image with no in-chart controls to operate.
Companion media, when applicable
There is no separate companion audio or video; the chart image is the full visual on this page.